Download
1 / 36

E N D
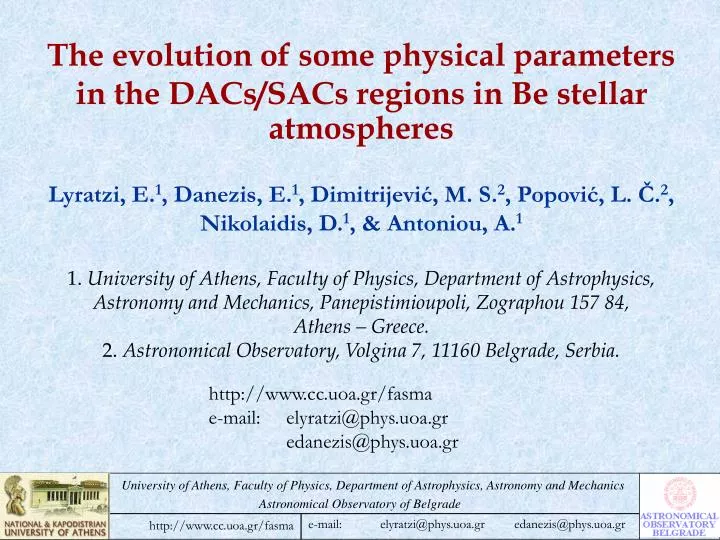
The evolution of some physical parameters in the DACs/SACs regions in Be stellar atmospheresLyratzi, E.1, Danezis, E.1, Dimitrijević, M. S.2, Popović, L. Č.2, Nikolaidis, D.1, & Antoniou, A.11. University of Athens, Faculty of Physics, Department of Astrophysics, Astronomy and Mechanics, Panepistimioupoli, Zographou 157 84,Athens – Greece.2. Astronomical Observatory, Volgina 7, 11160 Belgrade, Serbia. http://www.cc.uoa.gr/fasma e-mail: elyratzi@phys.uoa.gr edanezis@phys.uoa.gr
MgII λ 2795.523 (400) (1) 2802.698 (300) (1) Observation of unknown spectral lines in the spectra of Oe and Be stars Fe II (20) (198) Fe II (10) (373) Mg II (350) (3) Mg II (300) (1) Mg II (400) (1) Mg II (150) (3) HD 30386 B2 III LWR 09251 ? ? HD 45910 B2 III e LWR 06234
Satellite Components Such lines have been detected by many researchers, who have named them: Satellite Components (Peton 1973, Lamers et al. 1982, Sahade et al. 1984, Sahade & Brandi 1985, Hutsemékers 1985, Danezis 1984,1987, Danezis et al. 1991, 1995, 1997a, 1997b, Theodossiou et al. 1993, 1997, Laskarides et al. 1992, 1993, Stathopoulou et al. 1995, 1997) or Discrete Absorption Components (Bates & Halliwell 1986, Prinja 1988, 1992, Willis et al. 1989, Bates & Gilheany 1990, Gilheany 1990, Kaper et al. 1990, Waldron et al. 1992, 1994, Henrichs et al. 1994, Telting et al. 1993, Telting & Kaper 1994, Cranmer & Owocki 1996, Rivinious et al. 1997, Prinja et al. 1997, Fullerton et al. 1997, Kaper et al. 1996, 1997, 1999, Cranmer et al. 2000).
DACs (Bates & Halliwell 1986), now, are not unknown absorption spectral lines, but spectral lines of the same ion and the same wavelength as a main spectral line, shifted at different Δλ, as they are created from different density regions which rotate and move radially with different velocities. The DACs arediscrete lines, easily observed, in the spectra of some Be stars of luminosity class III. Definition of DACs DAC DAC
SAC SAC • If the regions that create such lines rotate quickly and move radially slowly, the produced lines are quite broadened and little shifted. So, they may not bediscrete absorption spectral lines, but blended among themselves. In such a case, they are not observable, but we can detect them through the analysis of the profile. As Peton (1974) first pointed out, these components appear as “satellites” in the violet or in the red side of a main spectral line, as a function of the time or the phase, in the case of a binary system. Definition of SACs For these two reasons and in order to include all these components, either they are discreet of not, to a unique name, we prefer to name them Satellite Absorption Components (SACs)(Danezis et al. 2005, 2007, Lyratzi & Danezis 2004) and not Discrete Absorption Components (DACs).
Main Purposes A mechanism responsible for the DACs/SACs creation should be able to explain the values of many physical parameters and the relations among them. Such parameters are: • Rotational Velocity (Vrot) • Radial Velocity (Vrad) • Random Velocity (Vrand) of the ions • Gaussian standard deviation (σ) • Full Width at Half Maximum (FWHM) • Optical depth • Absorbed or Emitted Energy • Column Density
Purpose of this study Calculation of some physical parameters, such as: Rotational Velocity (Vrot) Radial Velocity (Vrad) Full Width at Half Maximum (FWHM) Optical Depth (ξ) in the Si IV, Mg II and Ηα atmospherical regions and study the relation among these parameters. Si IV Lyratzi E.; Danezis, E.; Antoniou, A.; Nikolaidis, D.; Popovic, L. C.; Dimitrijevic, M. S.,2006, IAUJD, 4, 10 Mg II Lyratzi E.; Danezis, E.; Popović, L. Č.; Dimitrijević, M. S.; Nikolaidis, D.; Antoniou, A, 2007, PASJ, 59, 357 Ηα Lyratzi, E.; Danezis, E.; Nikolaidis, D.; Popović, L. Č.; Dimitrijević, M. S.; Theodossiou, E.; Antoniou, A., 2005, MSAIS, 7, 114
In our study we used the optical spectrataken byAndrillat & Fehrenbach (1982) andAndrillat (1983)(resolution 5.5 and 27 Å) (for Ηα) and the high resolution spectra (0.1 to 0.3 Å) taken withInternational Ultraviolet Explorer (IUE) found at theVILSPA database (http://archive.stsci.edu/cgi-bin/iue) (for Si IV and Mg II). Study of theSi IV, Mg II and Ηα atmospherical regions We studied: • the SiIV resonance lines at λλ 1393.755, 1402.77 Å in the spectra of 70 Be type stars of all the spectral subtypes and luminosity classes. • theMgII resonance lines at λλ 2795.523, 2802.698 Å in the spectra of 64 Be type starsof all the spectral subtypes and luminosity classes. • the Ηα spectral line at λ 6562.817 Å in the spectra of 120 Betype stars of all the spectral subtypes and luminosity classes.
Study of theSi IV resonance lines in the spectra of 70 Be stars
Study of theSi IV resonance lines (continued) The rotational velocityof thefive density regionsis of the order of40 km/s, 114 km/s, 251 km/s, 469 km/sand 828 km/s. The dispersion around the mean value increases from the first to the fifth density region.The observed dispersion may be due to the different values of the inclination angle of the density regions, where the satellite components are created.The five density regions do not appear in all the studied stars.
Study of theSi IV resonance lines (continued) The five density regionsmove with radial velocitiesof the order of -38 km/s, -53 km/s, -87 km/s, -116 km/sand +25 km/s.
Study of theSi IV resonance lines (continued) Apparent radial velocitiesof the five density regions of both members of Si IV doublet,as a function of the respective apparent rotational velocities. The dispersion of the apparent rotational velocity’s values increases with the increase of the rotational velocity.
Study of theSi IV resonance lines (continued) Theoptical depth ξin the center of the spectral linefor the five density regions lies, respectively, between the values a) 0.003and0.068, b) 0.004and0.078, c) 0.004and0.056, d) 0.003and0.046ande) 0.005and0.033, for the SiIV spectral line at1393.755 Å, anda) 0.002and0.055, b) 0.004and0.054, c) 0.003and0.040, d) 0.003and0.037ande) 0.003and0.021for theSi IV spectral line at 1402.77 Å.
Study of theSi IV resonance lines (continued) Ratio Vrot/Vphot of the first and second detected components of Si IV as a function of the photospheric rotational velocity (Vphot). The ratio Vrot/Vphotindicates how much the rotational velocity of the specific Si IV layer is higher than the apparent rotational velocity of the star.
Study of theMg II resonance lines in the spectra of 64 Be stars
Study of theMg II resonance lines (continued) Therotational velocityof the three density regionsis of the order of31 km/s, 60 km/s and 142 km/s. The dispersion around the mean value increases from the first to the third density region.The observed dispersion may be due to the different values of the inclination angle of the density regions, where the satellite components are created.The three density regions do not appear in all the studied stars.
Study of theMg II resonance lines (continued) All the three density regionsmove radially with almost zero velocity(-2km/s, +1km/sand +9 km/s). In the case of the stars that present Discrete Absorption Components(DACs), i.e. the starsHD 193237, HD 45910 andHD 144, the apparent radial velocity is about -222 km/sand -164 km/s, for the second and the third density region, respectively.
Study of theMg II resonance lines (continued) Apparent radial velocitiesof the three density regions of both members of Mg II doublet,as a function of the respective apparent rotational velocities. The points corresponding to the Discrete Absorption Components (DACs) are clearly seen.
Study of theMg II resonance lines (continued) Theoptical depth ξin the center of the spectral linefor the three density regionslies, respectively, between the values: a) 0.011 and 0.227 b) 0.008 and 0.138 και c) 0.008 and 0.055 for theMg II spectral line at2795.523Åand a) 0.011 and 0.203 b) 0.006 and 0.138 και c) 0.007 and 0.048 for theMg II spectral line at2802.698Å.
Study of the Ηα spectral line in the spectra of 120 Be stars • In most of the Be stellar spectra the Ha line presents peculiar and complex profiles. Usually the Ha line’s profile consists of: • a very broad absorption component (created in the chromosphere) • an emission component (created in the cool extended envelope) • a narrow absorption component (created in the cool extended envelope).
Study of the Ηα line (chromosphere) Therotational velocityof the five density regionsis 5200 km/s, 990 km/s, 536 km/s, 352 km/sand 152 km/s. The dispersion around the mean value may be due to the different values of the inclination angle of the density regions, which create the SACs and decreases from the first to the fifth density region.The five density regions do not appear in all the studied stars.
Study of the Ηα line (chromosphere) (continued) Mean values of the radial velocities, as a function of the spectral subtype and the luminosity class, of the five density regions in the chromosfphere. The radial velocity of each density region is15 km/s, 7 km/s, 19 km/s, 15 km/sand -2 km/s.
Study of the Ηα line (chromosphere) (continued) Rotational velocitiesof the five density regions in the chromosphere, as a function of the respective radial velocities.
Study of the Ηα line (chromosphere) (continued) Mean values of the optical depth ξ for the five density regions in the chromosphere, as a function of the spectral subtype. Theoptical depth in the center of the spectral line(ξ),for the five density regionsis between the values: a) 0.0020 and 0.0255, b) 0.0033 and 0.0964, c) 0.0029 and 0.1296, d) 0.0024 and 0.0196 and e) 0.0025 and 0.0230. The optical depthincreases from the supergiants towards the dwarfs.
Study of the Ηα line (cool extended envelope)(emission components) Mean values of the FWHMof the emission components, as a function of the spectral subtype. The main emission component presents a fluctuation of the FWHM around the value of7.1 Å. For the second emission component (when it appears) the fluctuation ofFWHM is around the value of 2.0 Å.
Study of the Ηα line (cool extended envelope)(emission components) (continued) Mean values of the radial velocities of the emission componentsas a function of the spectral subtype and the luminosity class. Theradial velocityof the two emission regions presents a fluctuation around the value of20 km/s.
Study of the Ηα line (cool extended envelope)(emission components) (continued) Radial velocitiesof the emission regions, as a function of the respective values of the FWHM.
Study of the Ηα line (cool extended envelope)(narrow absorption components) Mean values of the FWHMof the absorption components, as a function of the spectral subtype and the luminosity class. TheFWHM fluctuates around the value of 2.0 Å. TheFWHM decreases from the supergiants towards the dwarfs.
Study of the Ηα line (cool extended envelope)(narrow absorption components) (continued) Mean values of the radial velocity of the absorption components which is created in the cool extended envelope, as a function of the spectral subtype and the luminosity class. Theradial velocityfluctuates around the value of 0 km/s.
Study of the Ηα line (cool extended envelope)(narrow absorption components) (continued) Radial velocitiesof the absorption region, as a function of the respective values of the FWHM.
Study of the Ηα line (cool extended envelope)(narrow absorption components) (continued) Mean values of the optical depth in the center of the line (ξ) of the absorption component, which is created in the cool extended envelope, as a function of the spectral subtype. Theoptical depth in the center of the line(ξ)is between the values 0.0039 and 0.6250. The optical depth decreases from the supergiants towards the dwarfs.
Conclusions • The SACs phenomenon is general in the spectra of Be-type starsand characterizes the studied atmospherical regions (Si IV, Mg II και Ηα). • The SACs phenomenon is able to explain the peculiar and complex profiles that appear in the spectra of Be stars. The absorption profiles of the studied spectral lines are complex and peculiar, because they do not consist in only one spectral line, but in a group ofSACs, which are created inindependent density regions, which, of course, do not appear in all the studied stars. • We studied the relation among some physical parameters of the Si IV, Mg II and Ηα regions. In the future, based on these parameters, we should find the mechanisms which are responsible for the DACs/SACs formation.