Download
1 / 12
120 likes | 155 Views
SAVING. ROLE?. BANKS. STOCKS. RETIREMENT. future. PROVINCIAL AND HIGHLY URBANIZED CITY LEVEL ESTIMATION OF AVERAGE HOUSEHOLD SAVING RATE USING SPATIALLY CORRELATED RANDOM AREA EFFECTS MODEL. By Jared Jorim O. Mendoza Institute of Statistics College of Arts and Sciences

E N D
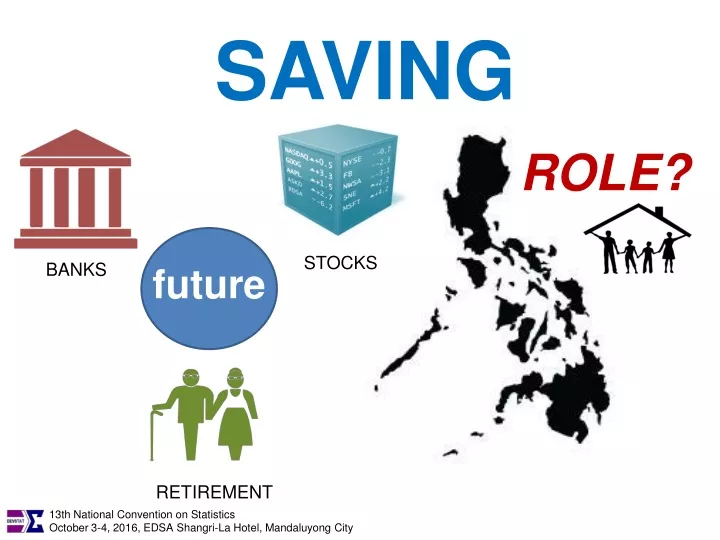
SAVING ROLE? BANKS STOCKS RETIREMENT future
PROVINCIAL AND HIGHLY URBANIZED CITY LEVEL ESTIMATION OF AVERAGE HOUSEHOLD SAVING RATE USING SPATIALLY CORRELATED RANDOM AREA EFFECTS MODEL By Jared Jorim O. Mendoza Institute of Statistics College of Arts and Sciences University of the Philippines Los Baños
estimates of the average household saving rate among provinces and highly urbanized cities (HUCs) ANNUAL INCOME ANNUAL EXPENDITURE ANNUAL SAVINGS Source of data: World Bank
Household Saving Rate in all Provinces and HUCs (FIES data) Auxiliary Variables (2010 CPH and Administrative data) Direct Estimation Classical Regression Model and Spatial Autoregressive (SAR) model (ρ and W were defined) Spatial Empirical Best Linear and Unbiased prediction (SEBLUP) Model Statistical Properties of Estimates
Table1. Distribution of the coefficient of variation of direct estimates of the average household saving rateof different provinces or HUCs in the Philippines. NCR Figure 2. Choropleth map of the provincial or HUC level direct estimates of the average household saving rate.
Figure 3. Moran’s I scatter plot. Figure 4.Spatial autocorrelation of average household saving rate using different distance threshold.
Table 2.Parameter estimates of the simultaneously autoregressive (SAR) model for provincial or city average household saving rate.
Table 3.Top ten provinces or HUCs with the highest reliable SEBLUP estimates of the average household saving rate Table 4.Top ten provinces or HUCs with the lowest reliable SEBLUP estimates of the average household saving rate NCR Figure 5.Choropleth map of the provincial or HUC level SEBLUP estimates of the average household saving rate.
Table 6.Distribution of the coefficient of variation of SEBLUP estimates of the average household saving rateof different provinces or HUCs in the Philippines. Figure 6.Box plot of the distribution of the computed CV of the SEBLUP estimates. Figure 7.Box plot of the distribution of the computed MSE of the SEBLUP estimates.
Majority (67%) of the provinces or HUCs have average household saving rate ranging from 5 to 15 percent • Less than half (46%) of the provinces or HUCs still have an average household saving rate below 10%
demographic characteristics: a younger population lower educational attainment of HH heads fewer household heads which are working overseas larger family size saving rate of households, on the average, in the province or HUC tends to decrease.
PROVINCIAL AND HIGHLY URBANIZED CITY LEVEL ESTIMATION OF AVERAGE HOUSEHOLD SAVING RATE USING SPATIALLY CORRELATED RANDOM AREA EFFECTS MODEL By Jared Jorim O. Mendoza Institute of Statistics College of Arts and Sciences University of the Philippines Los Baños