Download
1 / 33
330 likes | 465 Views
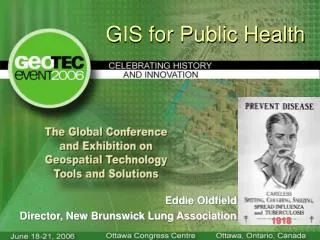
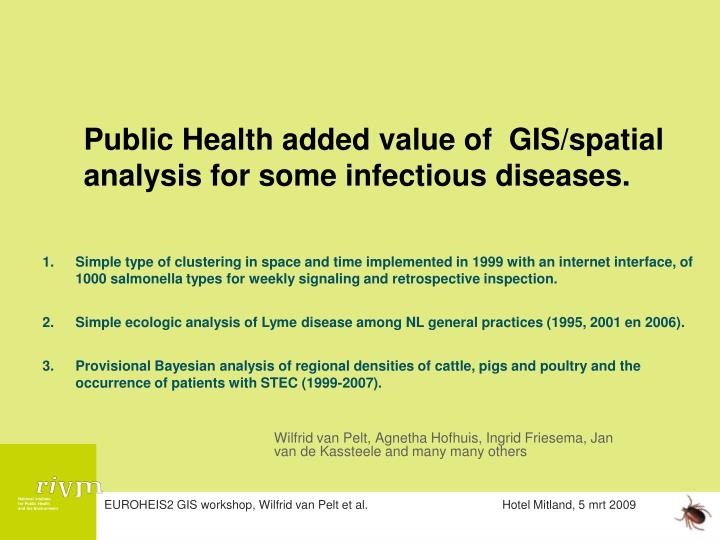
Public Health added value of GIS/spatial analysis for some infectious diseases. Wilfrid van Pelt, Agnetha Hofhuis, Ingrid Friesema, Jan van de Kassteele and many many others.

E N D
Public Health added value of GIS/spatial analysis for some infectious diseases. Wilfrid van Pelt, Agnetha Hofhuis, Ingrid Friesema, Jan van de Kassteele and many many others • Simple type of clustering in space and time implemented in 1999 with an internet interface, of 1000 salmonella types for weekly signaling and retrospective inspection. • Simple ecologic analysis of Lyme disease among NL general practices (1995, 2001 en 2006). • Provisional Bayesian analysis of regional densities of cattle, pigs and poultry and the occurrence of patients with STEC (1999-2007). EUROHEIS2 GIS workshop, Wilfrid van Pelt et al. Hotel Mitland, 5 mrt 2009
Course avian influenza epidemic, 2003poultryfarms, contaminated, culled Thanks to Michiel van Boven EUROHEIS2 GIS workshop, Wilfrid van Pelt et al. Hotel Mitland, 5 mrt 2009
Rubella notifications by 4 digit postal code The Netherlands, 1-9-2004 – 13-9-2005
MMR-1 coverage by municipality The Netherlands, 2004
Votes for SGP party by municipality National Elections, The Netherlands, 2003 Percentage of those allowed to vote Thanks to Susan Hahne
Outbreak detection by searching for clusters in region & time forSalmonella
Intranet Catalogue / Atlas since Mai 1998 • human/ animal/ food/ environment • All sero and phagetypes • Resistance • Actual trends, Early Warning, GIS-clusters Each week backcalculated starting in 1984 • >10.000 Tables and Figures EUROHEIS2 GIS workshop, Wilfrid van Pelt et al. Hotel Mitland, 5 mrt 2009
Explosions of S. Typhimurium ft 20 Early-Warning application
1st step signal verification:region • Silver wedding: • Case-control study rPHA • Coburgerham, salting process insufficient
1st stepsignalverification:region-crossingPlace, Age, Gender
1st step signalverification:precedent • No cause found: • RIVM trawling questionnair, too late • Animal Health Service, no clou in region
† Death (<2jr): 5 - 6 Hospitalized: 60-75 cases Hospital Labconfirmed: 297cases Laboratories Doctor visits: +/- 650 General Practices General Population: +/- 4455 GE-cases Symptomatic Infected General population Explosion of Salmonella Typhimurium DT7 cases In January 2006 up to April 2007 an explosion of S.T. DT7 infections occurred, resulting in an extra 297 lab-confirmed cases of salmonellosis. (tip of the Iceberg). COI: € 0.6 milj DALY: 54 Schattingen!! EUROHEIS2 GIS workshop, Wilfrid van Pelt et al. Hotel Mitland, 5 mrt 2009
Automatische geografische outbreak detectieKaas affaire Twente Salmonella Typhimurium Ft561 april 2007 1 jan 2006 half mei 2006
Automated geographic outbreak detectionKaas affaire Twente Salmonella Typhimurium Ft561 Januari to half mei 2006 half mai to end 2006
Not automated, by hand for publication, looks betterKaas affaire Twente Salmonella Typhimurium Ft561/DT7januari-december 2006 EUROHEIS2 GIS workshop, Wilfrid van Pelt et al. Hotel Mitland, 5 mrt 2009
Lyme disease in the Netherlands Agnetha Hofhuis & Wilfrid van Pelt and many others EUROHEIS2 GIS workshop, Wilfrid van Pelt et al. Hotel Mitland, 5 mrt 2009
Transmission of Lyme disease Lyme disease in Europe is caused by the Borrelia burgdorferi sensu lato group; B. burgdorferi sensu stricto, B. afzelii, B. garinii Transmission by the sheep tick (Ixodes ricinus). EUROHEIS2 GIS workshop, Wilfrid van Pelt et al. Hotel Mitland, 5 mrt 2009
Lyme disease Early local infection: erythema migrans (EM) 75 - 90% of B. burgdorferi infections Early disseminated infection: manifestations in nervous system, skin, joints and heart Chronic Lyme borreliosis… EUROHEIS2 GIS workshop, Wilfrid van Pelt et al. Hotel Mitland, 5 mrt 2009
Studies on Lyme disease in the Netherlands retrospective studies among general practitioners (GP’s) • Incidence of tick bites and erythema migrans • Geographical distribution in the Netherlands • Ecological risk factors for tick bites and erythema migrans retrospective analysis of hospital admissions for Lyme disease • Occurrence of hospital admissions for Lyme disease • Seasonal and annual trends in hospital admissions for Lyme disease collecting ticks in 4 different biotopes • Density of ticks & infection rate of ticks with Borrelia • Seasonal & annual trends EUROHEIS2 GIS workshop, Wilfrid van Pelt et al. Hotel Mitland, 5 mrt 2009
Retrospective GP-study postal questionnaire All (± 8.000) general practitioners (GP’s) in 1995, 2002 & 2006 received pre-coded questionnaire about previous year How many patients with tick bites have you seen? How many erythema migrans case-patients have you seen? How many people are included in your practice population? EUROHEIS2 GIS workshop, Wilfrid van Pelt et al. Hotel Mitland, 5 mrt 2009
Retrospective GP-study results • Response, coverage: 88% in 1994 68% in 2001 71% in 2005 • Tick bite consultations: 1994 30.0002005 73.000 • EM consultations:1994 6.0002005 17.000 Incidence of EM & tick bites per 100.000 inhabitants
Retrospective GP-study ecological risk factors Information on risk factors per municipality Roe deer Rabbits Horses Sheep & goats Cattle Woods Degree of urbanization Tourist nights per year Precipitation Parks & public gardens Sandy soil Uncultivated wet soil Uncultivated dry soil Dunes • Risk analysis for GP-studies of 1994, 2001 & 2005 together: • Poisson regression: (offset: city population) • city repeated measure • year “confounder” • no random (un)structered effects, sofar • no Bayesian smoothing, sofar EUROHEIS2 GIS workshop, Wilfrid van Pelt et al. Hotel Mitland, 5 mrt 2009
Retrospective GP-study ecological risk factors • Risk factors for erythema migrans • area covered with woods • area with sandy soil • mean precipitation • roe deer / km2 • rural area ( houses/km2) • tourist areas • Risk factors for tick bites • area with sandy soil • mean precipitation • density of roe deer • rural areas ( houses/km2) • tourist areas • cattle / km2 • rabbits / km2 EUROHEIS2 GIS workshop, Wilfrid van Pelt et al. Hotel Mitland, 5 mrt 2009
Geographical distribution of STEC in the Netherlands Wilfrid van Pelt ,Loes Bertens, Ingrid Friesema, Jan van de Kassteele (spatial statistician) EUROHEIS2 GIS workshop, Wilfrid van Pelt et al. Hotel Mitland, 5 mrt 2009
Generalities STEC-O157 infections Known, mentioned riskfactors: • Consumption raw milk/cheese (16%) • Contact farmanimal (21%) • Person-to-person transmission (18%) • Consumption ready-to-eat vegetables (28%) Most important reservoir: • Dairy cattle and veals Acute gastroenteritis with Complications • HUS (15%) and Hospital-uptake (41%), accent 0-4 year olds Provisionary analysis:Spatial relation Cattle density and STEC incidence EUROHEIS2 GIS workshop, Wilfrid van Pelt et al. Hotel Mitland, 5 mrt 2009
jan feb mrt apr mei jun jul aug sep okt nov dec 24% 9 21% 8 18% 7 Dairy Cattle Veals 6 15% 5 Human STEC O157 / 4wk, 1999-2007 12% Positive staples 4 9% 3 6% 2 3% 1 0 0% 1-4 5-8 9-12 13-16 17-20 21-24 25-28 29-32 33-36 37-40 41-44 45-48 49-52 4-weekly periods STEC season in Veals (1st), 1-2 weeks later in Humans and Dairy cattle 1999-2007 EUROHEIS2 GIS workshop, Wilfrid van Pelt et al. Hotel Mitland, 5 mrt 2009
Average (1997-2006) densities of farm animals / km2 EUROHEIS2 GIS workshop, Wilfrid van Pelt et al. Hotel Mitland, 5 mrt 2009
RR P2.5 P97.5 (Intercept) 0,6 0,4 0,8 Cattle: 1000/km2 6,4 1,0 45,2 Pig: 1000/km2 1,0 0,7 1,4 Poultry:1000/km2 1,0 0,9 1,0 Age 0-4 4,5 3,4 5,9 Age 5-9 1,6 1,2 2,1 Age 10-49 0,5 0,4 0,7 Age 50+ 1,0 Males 1,0 Females 1,3 1,0 1,6 Neighbour matrix of 496 communities WinBUGS model called from R using R2WinBUGS libraryModel results EUROHEIS2 GIS workshop, Wilfrid van Pelt et al. Hotel Mitland, 5 mrt 2009
[0,1.62] (1.62,4.7] (4.7,7.34] (7.34,11.1] (11.1,16.8] (16.8,22.4] (22.4,31.6] STEC cases Incidence / 1.000.000 STEC-O157 in NL 1999-2006 (2.4 / 106 inhabitants; 40-50 / yr.; N=400) Bayesian “smoothed” version (SMR) EUROHEIS2 GIS workshop, Wilfrid van Pelt et al. Hotel Mitland, 5 mrt 2009
STEC-O157 model: Structured and unstructured random effects (residuals) EUROHEIS2 GIS workshop, Wilfrid van Pelt et al. Hotel Mitland, 5 mrt 2009
GIS wishes • Web-based GIS-tool for questioning both numerators (disease, risk factor) and denominators (underlying population size): • Physicians (EU wide): practice size (denominator), number of Lyme consults (numerator) • Children DayCare Centres (NL): weekly reporting children at risk (denominator) and absenteism infectious diseases (numerator) • Immediately mapping and feeding back the rates to GP or DCC, regional PH-body (GGD) and national PH-body (RIVM) • Accurate incidence figures for regional comparison and analysis of regional risk factors • Condition: • Small, fast web-based application ignoring the artistic selfrespect of GIS developers EUROHEIS2 GIS workshop, Wilfrid van Pelt et al. Hotel Mitland, 5 mrt 2009