Download
1 / 16
480 likes | 1.43k Views
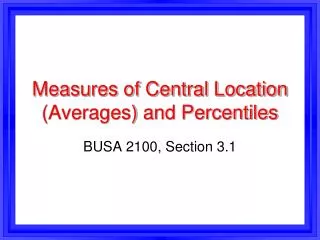
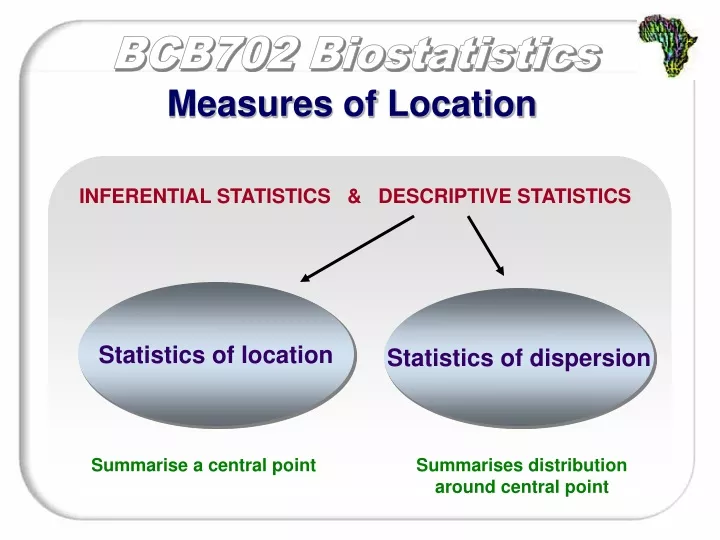
Measures of Location. INFERENTIAL STATISTICS & DESCRIPTIVE STATISTICS. Statistics of location. Statistics of dispersion. Summarise a central point. Summarises distribution around central point. For a sample :. For a population:. Measures of Location. ARITHMETIC MEAN.

E N D
Measures of Location INFERENTIAL STATISTICS & DESCRIPTIVE STATISTICS Statistics of location Statistics of dispersion Summarise a central point Summarises distribution around central point
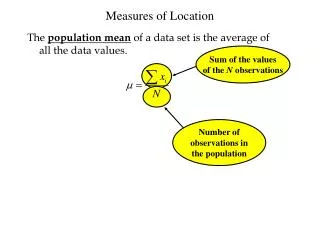
For a sample: For a population: Measures of Location ARITHMETIC MEAN Sum all observation, then divide by number of observations
18 16 14 X=7.07 12 10 No. of People 8 6 4 2 0 3.5 4.5 5.5 6.5 7.5 8.5 9.5 10.5 11.5 Nightly Hours of Sleep Measures of Location
Value that has equal no. of observations (n) on either side 5 4 For N = 15 the median is the eighth score = 37 3 Frequency 2 1 0 33 34 35 36 37 38 39 40 Score Measures of Location MEDIAN MEDIAN
Value that has equal no. of observations (n) on either side 5 4 For N = 16 the median is the average of the eighth and ninth scores = 37.5 3 Frequency 2 1 0 33 34 35 36 37 38 39 40 Score Measures of Location MEDIAN
5 4 For a given sample N=16: 33 35 36 37 38 38 38 39 39 39 39 40 40 41 41 45 The mode = 39 3 Frequency 2 1 0 33 34 35 36 37 38 39 40 41 42 43 44 45 Score Measures of Location MODE • the most frequently occurring score value • corresponds to the highest point on the frequency distribution
Measures of central tendency Summary Measures of Location
DISPERSION These are measures of how the observations are distributed around the mean Measures of Location
DISPERSION: Range Measures of Location
DISPERSION: Variance Measures of Location mean = 50 To see how ‘deviant’ the distribution is relative to another, we could sum these scores But this would leave us with a big fat zero
DISPERSION: Variance SS= ∑(X-X)2 Measures of Location So we use squared deviations from the mean, which are then summed This is the sum of squares (SS)
For a population: DISPERSION: Variance (to correct for the fact that sample variance tends to underestimate pop variance) For a sample: Measures of Location We take the “average” squared deviation from the mean and call it VARIANCE
DISPERSION: Standard deviation Measures of Location The standard deviation is the square root of the variance The standard deviation measures spread in the original units of measurement, while the variance does so in units squared. Variance is good for inferential stats. Standard deviation is nice for descriptive stats.
14 DISPERSION 12 N = 28 X = 50 s2 = 140.74 s = 11.86 10 8 # of People 6 4 2 N = 28 X = 50 s2 = 555.55 s = 23.57 0 0 10 20 30 40 50 60 70 80 90 100 Scores Measures of Location
For a population: For a sample: Mean Variance Standard Deviation Measures of Location DISPERSION
DISPERSION The Standard Error, or Standard Error of the Mean, is an estimate of the standard deviation of the sampling distribution of means, based on the data from one or more random samples e.g. 15 students each compile data sets of the heights of 20 people Numerically, it is equal to the square root of the quantity obtained when s squared is divided by the size of the sample. s s = X n and Measures of Location