Download
1 / 65
650 likes | 789 Views
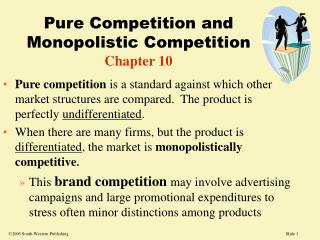
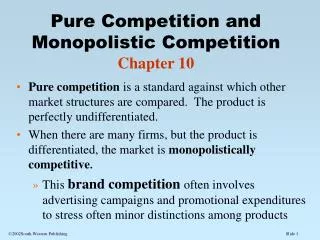
Chapter 10 Profits, Prices, and Costs Under Competition. Competition. A Competitive Market operates under the following conditions: There are many buyers and sellers; Goods produced are essentially the same; There are little or no barriers to entry and exit.

E N D
Chapter 10 Profits, Prices, and Costs Under Competition
Competition A Competitive Marketoperates under the following conditions: There are many buyers and sellers; Goods produced are essentially the same; There are little or no barriers to entry and exit. These conditions imply that no single buyer or seller has any influence on the market price and that all firms must sell their output at the same market price.
Competition Market Demand and Firm Demand The Market for Oil The Demand for Your Oil Price Price Market Supply Demand for Your Oil $50 Market Demand 82,000,000 Quantity (barrels) Quantity (barrels)
In a competitive market, what happens when a firm prices its product above the market price? Below the market price? • What kind of demand elasticity curve does the competitive firm face? • How can a firm that produces oil face a very elastic demand curve when the demand for oil is inelastic?
Competition and Profit Maximization The goal of all firms is to maximize profit. Profitis calculated as the difference between total revenue and total cost. Profit = Total Revenue – Total Cost = TR – TC Total Revenue is price times quantity sold: TR = P x Q. Total Cost is the cost of producing a given quantity of output. Total Cost has two components. Fixed Costsare costs that do not vary with output. Variable Costsare costs that do vary with output. Since a firm in a competitive market must sell its output at the market price, profit maximization depends only on the firm’s output decision.
Competition and Profit Maximization How does a firm in a competitive market decide how much to produce in order to maximize profit? To maximize profit the firm must think at the margin in its output decision. Marginal Revenue (MR)is the change in total revenue from selling an additional unit of output. Marginal Cost (MC)is the change in total cost from producing an additional unit of output.
Competition and Profit Maximization To maximize profit a competitive firm will expand production until the revenue from an additional sale equals the cost of an additional sale. If marginal revenue is greater than marginal cost (MR > MC), then an additional unit of output increases revenues more than costs leading to greater profit. If marginal revenue is less than marginal cost (MR < MC), then an additional unit of output increases costs more than revenues leading to less profit. So, profit is maximized at a level of output where MR = MC.
Competition and Profit Maximization Marginal Revenue is calculated as Since firms in competitive markets must sell their goods at the market price, each sale increases total revenue by the market price (i.e., MR = P). Marginal Cost is calculated as
Competition and Profit Maximization Profit is Maximized Where P = MC $ 150 MC 100 Maximum Profit More Profit 50 MR = P More Profit q 0 1 2 3 4 5 6 7 9 10 8
Competition and Profit Maximization For a competitive firm the profit-maximizing quantity is where MR = MC. Since MR = P for the competitive firm, the profit-maximizing quantity in competition occurs where P = MC. If the price of the good rises, the firm will expand production along its MC curve. Thus, as long as the firm remains in the industry, the firm’s MC curve is its supply curve.
Competition and Profit Maximization As the Price Changes so Does the Profit-Maximizing Quantity $ MC $100 MR = P $50 MR = P q 0 1 2 3 4 5 6 7 8 9 10
Let’s check our MR = MC rule for maximizing profit. Look at the last column in Figure 10.1, which shows the change in profit. When the firm produces 4 barrels rather than 3, how much additional profit is made? How about when it goes from 7 barrels to 8? From 8 barrels to 9? Now look at the MR and MC columns and find the profit-maximizing quantity. How does it compare to what you observe in the last column of the table?
Competition Minimizes Total Costs Firms in competitive markets increase output until P = MC. Furthermore, the conditions of a competitive market imply that every firm in the market faces the same price. Thus, in a competitive market with N firms, the following must be true: P = MC1 = MC2 = … = MCN.
Competition Minimizes Total Costs To fully understand the importance of this result, suppose that a farmer owns two farms on which to grow corn. Farm 1 is a hilly region which is costly to seed and plow while Farm 2 is ideal for growing corn. If the farmer wants to grow 200 bushels of corn, marginal cost would be higher on Farm 1 than on Farm 2.
Competition Minimizes Total Costs Marginal Cost of Producing 200 Bushels of Corn on Farm 1 and Farm 2 $ $ Farm 2 Farm 1 MC1 MC2 Bushels of Corn Bushels of Corn 200 200
Competition Minimizes Total Costs Given the cost structures of the two farms, how much corn should the farmer plant on each farm in order to minimize the total cost of growing 200 bushels of corn? It may seem that the lowest cost method of producing 200 bushels is to grow all 200 bushels on Farm 2.
Competition Minimizes Total Costs Thinking in marginal terms indicates that only using Farm 2 to grow 200 bushels is not the lowest cost approach. Instead of producing all 200 bushels on Farm 2, suppose the farmer lowers production to 197 bushels on Farm 2 and raises production to 3 bushels on Farm 1. Total costs of production on Farm 2 will decrease while total costs of production will rise on Farm 1.
Competition Minimizes Total Costs Lowering Production on Farm 2 and Raising Production on Farm 1 Lowers Total Costs of Producing 200 Bushels of Corn $ $ Farm 2 Farm 1 MC1 more here less here MC2 A B Bushels of Corn Bushels of Corn 3 197 200
Competition Minimizes Total Costs The decrease in costs of production on Farm 2 is greater than the increase in costs of production on Farm 1, so total costs will fall. The farmer will continue to reallocate production on the two farms until total costs stop falling. To minimize total costs of production, the farmer will set output on the two farms so that marginal costs are equal.
Competition Minimizes Total Costs To Minimize the Total Costs of Production Across Two Farms Choose Output to Make Marginal Costs Equal $ $ Farm 2 Farm 1 MC1 MC2 MC1 MC2 Bushels of Corn Bushels of Corn 75 125 200
Competition Minimizes Total Costs Instead of one person owning the two farms, suppose that Farm 1 is owned by Sandy and is located in North Carolina and that Farm 2 is owned by Pat and is located in Iowa. Will production be organized in such a manner that total costs of production will be minimized?
Competition Minimizes Total Costs To maximize profits on Farm 1, Sandy will produce a level of output such that P = MC1. To maximize profits on Firm 2, Pat will produce a level of output such that P = MC2. Sandy and Pat sell their corn in the same competitive market, so they both face the same price for their corn. As a result P = MC1 = MC2.
Competition Minimizes Total Costs This result is exactly the same as that of a single owner. By acting in their own self interest (i.e., profit maximization), Sandy and Pat choose the output levels that minimize total costs. Competitive markets, thus, allocate production across firms that minimizes total costs of production.
If the MC of production on Sandy’s farm is higher than on Pat’s farm, how should production be rearranged to minimize the total costs of production?
Profits and the Average Cost Curve In competition a firm maximizes profits by producing the level of output where P = MC. But what are profits at this level of output? Constructing a model of a competitive firm requires knowledge of its average cost. Average Cost is the per unit cost of production.
Profits and the Average Cost Curve Since average cost is influenced by both fixed cost and variable cost, the average cost curve will be U shaped. At first, average cost decreases as fixed costs of production are spread over greater quantities. As quantity approaches the capacity of the firm’s production facility, variable costs increase causing average cost to rise.
Profits and the Average Cost Curve Profit = (P – AC)*q $ MC $50 MR = P a Profit $25.75 AC b $17 q 0 1 2 3 4 5 6 7 8 9 10
Profits and the Average Cost Curve The model reveals a number of important items. Profit is positive whenever P > AC, and since P = MC, profit is positive whenever MC > AC or whenever the MC curve is above the AC curve. Profit is negative whenever P < AC, and since P = MC, profit is negative whenever MC < AC or whenever the MC curve is below the AC curve. Profit is zero when MC = AC or where the MC curve intersects the AC curve.
Profits and the Average Cost Curve Maximum Profit Can Be a Loss $ MC P < AC is a loss P > AC is a profit Loss AC $17 q MR = P $4 0 2 3 4 5 6 7 8 9 10 1
Costs and Entry Under Competition Another important element of the model relates to the point where profit is zero. Profit is zero when MC = AC or where the MC curve intersects the AC curve. The MC curve intersects the AC curve at its minimum point. When marginal cost is just below average cost, the AC curve is falling. When marginal cost is just above average cost, the AC curve is rising. So, AC and MC curves must meet at the minimum of the AC curve.
Use average costs to define profit for the competitive firm. • Using average cost, describe all the prices at which the firm would make a profit and all the prices at which a firm would make a loss.
Entry and Exit Under Competition In competitive markets a firm will be profitable when P > AC and unprofitable when P < AC. So, in the long run, firms will enter profitable industries (P > AC) and will exit unprofitable ones (P < AC). Note that at the intermediate point (P = AC) profits are zero, and there is no entry or exit. Economists refer to Zero Profitsor normal profits as the profit level where the firm is covering all of its costs including enough to pay labor and capital their opportunity costs.
Entry and Exit with Uncertainty and Sunk Costs The entry and exit rules discussed above involve some significant complications that firms in the real world must take into account. If P < AC, the firm will exit the industry in the long run, but what about the short run? Will the firm shut down immediately if price dips below average cost? Not necessarily
Entry and Exit with Uncertainty and Sunk Costs A firm may not immediately shut down when price falls below average cost because shutdown does not immediately eliminate all costs. Even when the firm ceases to produce any output, it will incur some fixed costs in the short run (e.g., rent, mortgage interest, taxes, insurance). Thus, the shutdown decision for the firm in the short run depends on the nature of the firm’s variable costs. If price, though below average cost, is high enough to cover the variable costs, then the firm generates sufficient revenue to pay its variable costs and some of its fixed costs. If, however, the price is so low that the firm cannot meet its variable costs, then shutdown reduces costs to the fixed costs only. Both options lead the firm to minimize its losses.
Entry and Exit with Uncertainty and Sunk Costs Another reason why a firm may not shut down immediately when P < AC is that the shutdown process can often be costly. When a firm ceases operations, it might have to lay off its employees. Firing employees may involve costs such as severance payments or other benefit packages. Additionally, firms often incur training costs when hiring new employees. By continuing operations during periods of losses, a firm can avoid hiring and firing costs. Note that the firm will only take this approach if it expects to be profitable again at some point in the future.
Entry and Exit with Uncertainty and Sunk Costs The same logic above applies to a firm’s entry decision when P > AC. Entry into an industry often requires an investment by the firm that cannot easily be recovered when it exits the industry. A Sunk Costis any cost that cannot be recovered. As such, a firm will only enter into an industry when it expects that price will remain above average cost long enough to recover all sunk costs.
Entry and Exit with Uncertainty and Sunk Costs If a firm could instantly and costlessly enter and exit an industry then the basic rule applies – enter when P > AC and exit when P < AC. But, when it is costly to enter and exit and there is uncertainty about future prices, firms must make their decisions based on their lifetime expected profit. Note that this estimation can be quite difficult to make, and any error could lead to significant losses.
Suppose that it costs a billion dollars to drill an oil well in the Mexican gulf. The well will be profitable if oil is priced at $60 a barrel or higher. The price of oil hits $65 a barrel. Is it time to start drilling? Suggest why or why not?
The Balance of Industries Remember that profit is total revenue minus total costs. Total revenue measures the value of the output being produced while total costs represent the value of inputs used in production. High profits mean that outputs of high value are being created from low value inputs. Profit is, thus, a signal that limited inputs are being used productively in satisfying wants.
The Balance of Industries Suppose that the computer industry is more profitable than the car industry. In this situation inputs are creating more value in the computer industry than the car industry. To use limited resources effectively, they must flow to the computer industry.
The Balance of Industries Successful entrepreneurs divert limited resources from low profit areas of the economy to high profit areas. Entrepreneurs chase profits by entering (high profit) and exiting (low profit) industries. Competitive markets, through this entry and exit process, balance production across industries such that the total value of production is maximized.
The Balance of Industries Profits encourage entry while losses encourage exit; entry reduces profit, and exit reduces losses. The Elimination Principleimplies that above normal profits are eliminated by entry, and below normal profits are eliminated by exit. Since no one profits from the commonplace, an entrepreneur must innovate to earn above normal profits. Furthermore, those who fail to innovate will be displaced by those who do through what economist Joseph Schumpeter called the process of Creative Destruction.
In Chapter 5, we saw how prices are signals. In competitive markets, how are profits a signal? • In a competitive market, how does a firm make profits if it has no control over price?
Industry Supply Curves The industry supply curve is built from the MC curves and the entry and exit decisions of firms. A firm will enter when P > AC and will expand production along its MC curve when price rises above this level. Thus, a firm’s supply curve is the portion of the MC curve above the AC curve. The industry supply curve is found by adding up the quantity supplied by each firm in the industry at every price.
Industry Supply Curves Quantity Supplied by the Industry is the Sum of the Quantities Supplied by Each Firm at Every Price $ $ MC1 MC2 AC2 $50 AC1 $29 $17 q q 0 0 10 1 2 3 4 5 6 7 8 9 1 2 3 4 5 6 7 8 9 10 Firm 1 Firm 2
Industry Supply Curves Quantity Supplied by the Industry is the Sum of the Quantities Supplied by Each Firm at Every Price $ S $50 $29 $17 q 0 1 2 3 4 5 6 7 8 9 10 11 12 13 14 15 16 17
Industry Supply Curves The shape of the supply curve for a particular industry is determined by the change in costs as industry output increases or decreases. There are three types of industry supply curves. Increasing Cost Industry is an industry in which costs increase with greater output; shown with an upward sloping supply curve. Constant Cost Industryis an industry in which costs do not change with greater output; shown with a flat supply curve. Decreasing Cost Industryis an industry in which industry costs decrease with greater output; shown with a downward sloping supply curve.