Download
1 / 14
140 likes | 151 Views
Learn how to graph and solve equations involving absolute value functions. Understand the V-shape graph, vertex, slope, and symmetry. Practice identifying and graphing absolute value functions.

E N D
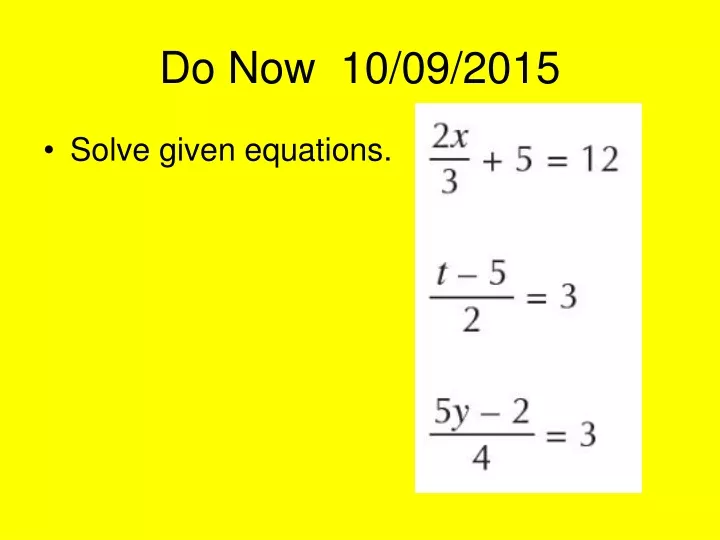
Do Now 10/09/2015 • Solve given equations.
Absolute value • written as ⎜x⎟, represents the distance between x and 0 on a number line. As a distance, absolute value is always positive. For every point on a number line, there is another point on the opposite side of 0 that is the same distance from 0. For example, both 5 and –5 are five units away from 0. Thus, ⎜−5⎟ = 5 and ⎜5⎟ = 5.
The graph of this piecewise function consists of 2 rays, is V-shaped and opens up. To the left of x=0 the line is y = -x To the right of x = 0 the line is y = x Notice that the graph is symmetric in the y-axis because every point (x,y) on the graph, the point (-x,y) is also on it.
y = a |x - h| + k • Vertex is @ (h,k) & is symmetrical in the line x=h • V-shaped • If a< 0 the graph opens down (a is negative) • If a>0 the graph opens up (a is positive) • The graph is wider if |a| < 1 (fraction < 1) • The graph is narrower if |a| > 1
To graph y = a |x - h| + k • Plot the vertex (h,k) (set what’s in the absolute value symbols to 0 and solve for x; gives you the x-coord. of the vertex, y-coord. is k.) • Use the slope to plot another point to the RIGHT of the vertex. • Use symmetry to plot a 3rd point • Complete the graph
Graph y = -|x + 2| + 3 • V = (-2,3) • Apply the slope a=-1 to that point • Use the line of symmetry x=-2 to plot the 3rd point. • Complete the graph
Do Now 10/12/2015 • Graph
The vertex is @ (0,-3) • It has the form: • y = a |x - 0| - 3 • To find a: substitute the coordinate of a point (2,1) in and solve • (or count the slope from the vertex to another point to the right) • Remember: a is positive if the graph goes up • a is negative if the graph goes down So the equation is: y = 2|x| -3
Write the equation for: y = ½|x| + 3
Practice/Homework Worksheet: Graphing Absolute Value Functions Identifying Absolute Value Function equations Homework: Textbook P.71~72