Download
1 / 21
210 likes | 308 Views
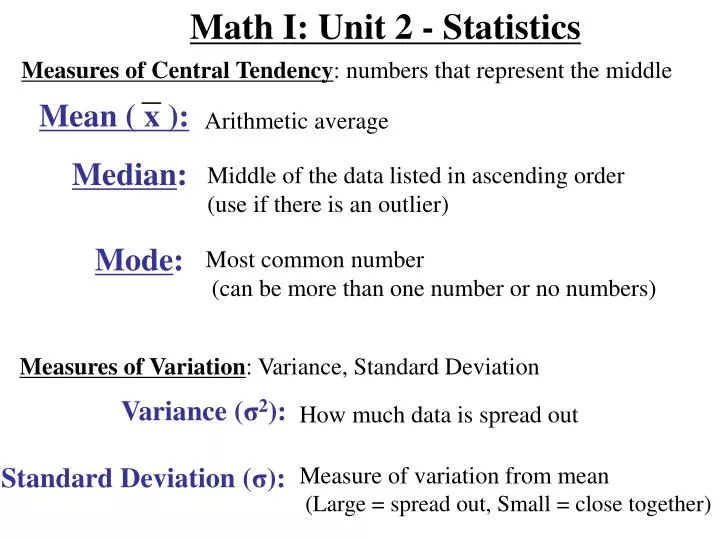
Mean ( x ):. Math I: Unit 2 - Statistics. Measures of Central Tendency : numbers that represent the middle. Arithmetic average. Median :. Middle of the data listed in ascending order (use if there is an outlier). Mode :. Most common number (can be more than one number or no numbers).

E N D
Mean ( x ): Math I: Unit 2 - Statistics Measures of Central Tendency: numbers that represent the middle Arithmetic average Median: Middle of the data listed in ascending order (use if there is an outlier) Mode: Most common number (can be more than one number or no numbers) Measures of Variation: Variance, Standard Deviation Variance (σ2): How much data is spread out Standard Deviation(σ): Measure of variation from mean (Large = spread out, Small = close together)
Range: Difference between the Maximum and Minimum Quartiles: Separates ascending data into 4 equally sized(25%) groups based on the how many data values Inner Quartile Range (IQR): Difference between 3rd and 1st Quartiles (Middle 50% of data) 5 Number Summary: Min: Minimum Value (0 Percentile) Quartile 1 (25th Percentile) Q1: Med (Q2): Median (50th Percentile) Q3: Quartile 3 (75th Percentile) Maximum or Q4 (100th Percentile) Max:
Boxplot: “Box and Whisker” Whiskers represent outside quartiles (Min to Q1 and Q3 to Max) Boxes Represent inside quartiles (Q2 to Med and Med to Q3) 25% 25% 25% 25% IQR: Q3 – Q1 Range: Max – Min Skewed Left (negatively): Skewed Right (positively): Min Med Max Less data to the left (spread out) Less data to the right (spread out). Q2 Q1 Q3 Q4
Calculator Commands:One Variable Statistics Input Data: [STAT] [EDIT] L1 DO NOT DELETE Lists: HighlightL1 [Clear] to start new list of data Get Statistics from Data: [STAT] [CALC] [1: 1-Var STATS] [ENTER] Minimum 1st Quartile Median 3rd Quartile Maximum Mean Standard Deviation REQUIRED Statistics by Hand! • Identify the MODE by looking for the most common number(s) Use Five-Number Summary to calculate • IQRwith Q3 and Q1 • RANGEwith maximum and minimum
Example #1: Listed below are the weights of 10 people (in lbs) 130, 150, 160, 145, 142, 143, 170, 132, 145, 156 130 142 145 156 170 147.3 145 (x2) 11.62 Mean: __________________ Mode: __________________ Standard Deviation: __________________ IQR: __________________ Range: ________________ Skewed: Positive(Right), Negative (Left), or Normal Minimum: _________ 1st quartile: _________ Median: _________ 3rd quartile: _________ Maximum: _________ 14 = 156 – 142 = Q3 – Q1 40 = 170 – 130 = Max – Min #1b: Change the 130 to a 120 and the 156 to a 166. Recalculate What changed? Why? Make a box plot for the weights: Standard deviation, Range The data is more spread out
Class Data set of “The day of the month you were born on” Mean: __________________ Mode: __________________ Standard Deviation: __________________ IQR: __________________ Range: ________________ Skewed:Positive(Right), Negative (Left), or Normal Minimum: _________ 1st quartile: _________ Median: _________ 3rd quartile: _________ Maximum: _________ Make a box plot for the days:
PRACTICE: Find the mean and standard deviation #1: The following is the amount of black M&M’s in a bag: 12, 13, 14, 15, 15, 16, 17, 20, 21, 22, 23, 24, 25 Mean: 18.23 Standard Deviation: 4.28 #2: The following is the amount of black M&M’s in a bag: 9, 10, 11, 14, 15, 16, 17, 20, 21, 23, 26, 27, 28 [Default] [MC Any] [MC All] Mean: 18.23 Standard Deviation: 6.24 #3: Explain why the means are the same but the standard deviation is larger for the 2nd example. The data is more spread out although it’s the same average.
Interpreting Boxplots: Test Scores (n=60) How many test scores are in each quartile? Between what scores do the middle 50% lie? Between what scores does the lowest 25% lie? Which range of scores has more density? (more numbers in a smaller number) 4. Estimate how many people got between 85-89? 5. Estimate how many people got below an 85? 6. What is the IQR? 7. What percentile did a person with a 70 get? .25*60 = 15 70-89 55-70 85-89 15 30 89-70 = 19 25
Box plot of 80 Bowlers 60 70 80 90 100 110 120 130 140 145 • Estimate the values of the five-number summary • Min = ____Q1 = _____ Med = _____ Q3 = _____ Max = _____ • What is the number of bowlers in each quartile? • What is the maximum score? • What is the IQR? • What percentage of bowlers got above a 85? • How many bowlers got below a 100? • What percentile did a 120 get? • Between what scores did the top 25% get? • Where is the lowest density of bowlers? 120 140 85 60 100 80*.25=20 140 120 – 85 = 35 25 + 25 + 25 = 75 20 + 20 = 40 75% (75% are below) 120 to 140 First Quartile: 60 to 85
VARIABILITY: How close the numbers are together MORE spread out data: = HighVariability = Large Standard Deviation = High IQR [Default] [MC Any] [MC All] LESS spread out data: = Low Variability = Small Standard Deviation = Low IQR
#1) Which of the following will have the most variability? • Heights of people in this room • Ages of people in this room • The number of countries that people have been to in this room? [Default] [MC Any] [MC All]
#2) Which would have a lower standard deviation? (Be prepared to explain): • Heights of students in this class • Heights of students in this school [Default] [MC Any] [MC All]
Normal Distribution: “Bell Curve” “Equal amount of data” to left and right of middle Skewed Right: (Positively) Skewed Left (Negatively): Less data (spread out) to the Left Less data (spread out) to the Right
Determine if the following examples are Normally Distributed, Positively, or Negatively Skewed. Negatively(Left) Positively(Right) Normally
Determine if the following examples are Normally Distributed, Positively, or Negatively Skewed. Negatively (Left) Positively (Right) Normally Positively(Right) Negatively (Left) Normally
DEBATE:Think about possible PROS and CONS of each • Side 1:You are trying to convince your teacher to always curve test grades to a standard deviation • Side 2: You are trying to convince your teacher to never curve test grades to a standard deviation
Place the following under negatively skewed, normally distributed, or positively skewed, or random? • The amount of chips in a bag • The sum of the digits of random 4-digit numbers? • The number of D1’s that students in this class have gotten? • The weekly allowance of students • Age of people on a cruise this week F) The shoe sizes of females in this class
Deeper Understanding • Suppose there are 20 tests and the scores are all an 80%. What would change if 2 more tests were added that were both a 90%, mean or median? • What if there were 20 tests, 4 were 70%, 12 were 80%, and 4 were 90%. Three more tests were added to group scoring 70%, 90%, and 100%. How would the mean or median change?
Mode: Most often number. Mean: Average. Median: The middle number when arranged from smallest to largest. Best to show when there are outliers!!! 1) Find the mode, mean, and median: 5,7,9,9,30 9 12 9 2) Which is the largest? Mean 3) Now include a 90 in the data. Which of the three changed the most? Mean: It went from 12 to 25 4) When they list salaries, why do they state the median price and not the mean price? Median is less affected by outliers
Trick or Treat • Ten neighborhood kids went out to get candy. Here is a list of the number of treats they received: 45, 34, 56, 32, 10, 32, 62, 11, 55, 34 • Find the mean, median, and IQR of the treats. • The kid who got 62 treats, went back out and got 262 treats. Find the new mean, median and IQR. • Which does a better job of describing the typical number of treats for the new data? Why? • Draw a box plot.
PRACTICE FIVE-NUMBER SUMMARY: Find the 5 number summary and draw a box plot. Maria: 8, 9, 6, 7, 9, 8, 8, 6, 9, 9, 8, 7, 8, 7, 9, 9, 7, 7, 8, 9 Gia: 8, 9, 9, 9, 6, 9, 8, 6, 8, 6, 8, 8, 8, 6, 6, 6, 3, 8, 8, 9 6 Min: 3 Min: Q1: 6 Q1: 7 Q2 (median): 8 Q2 (median): 8 Q3: 9 Q3: 8.5 Max: 9 Max.: 9 Interquartile Range (IQR): Interquartile Range (IQR): 8.5 – 6 = 2.5 9 – 7 = 2 6 8.5 9 3 6 7 8 9 8