Download
1 / 1
10 likes | 115 Views
ABSTRACT

E N D
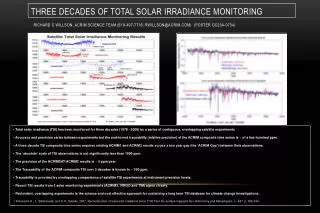
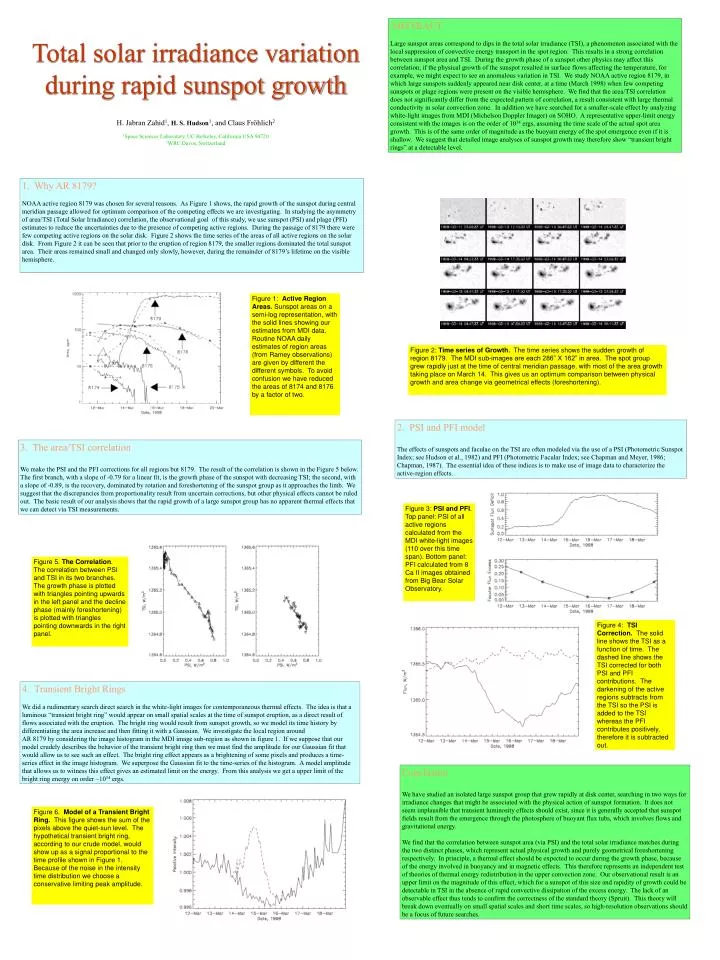
ABSTRACT Large sunspot areas correspond to dips in the total solar irradiance (TSI), a phenomenon associated with the local suppression of convective energy transport in the spot region. This results in a strong correlation between sunspot area and TSI. During the growth phase of a sunspot other physics may affect this correlation; if the physical growth of the sunspot resulted in surface flows affecting the temperature, for example, we might expect to see an anomalous variation in TSI. We study NOAA active region 8179, in which large sunspots suddenly appeared near disk center, at a time (March 1998) when few competing sunspots or plage regions were present on the visible hemisphere. We find that the area/TSI correlation does not significantly differ from the expected pattern of correlation, a result consistent with large thermal conductivity in solar convection zone. In addition we have searched for a smaller-scale effect by analyzing white-light images from MDI (Michelson Doppler Imager) on SOHO. A representative upper-limit energy consistent with the images is on the order of 1034 ergs, assuming the time scale of the actual spot area growth. This is of the same order of magnitude as the buoyant energy of the spot emergence even if it is shallow. We suggest that detailed image analyses of sunspot growth may therefore show “transient bright rings” at a detectable level. Total solar irradiance variation during rapid sunspot growth H. Jabran Zahid1, H. S. Hudson1, and Claus Fröhlich2 1Space Sciences Laboratory, UC Berkeley, California USA 94720 2WRC Davos, Switzerland 1. Why AR 8179? NOAA active region 8179 was chosen for several reasons. As Figure 1 shows, the rapid growth of the sunspot during central meridian passage allowed for optimum comparison of the competing effects we are investigating. In studying the asymmetry of area/TSI (Total Solar Irradiance) correlation, the observational goal of this study, we use sunspot (PSI) and plage (PFI) estimates to reduce the uncertainties due to the presence of competing active regions. During the passage of 8179 there were few competing active regions on the solar disk. Figure 2 shows the time series of the areas of all active regions on the solar disk. From Figure 2 it can be seen that prior to the eruption of region 8179, the smaller regions dominated the total sunspot area. Their areas remained small and changed only slowly, however, during the remainder of 8179’s lifetime on the visible hemisphere. Figure 1: Active Region Areas. Sunspot areas on a semi-log representation, with the solid lines showing our estimates from MDI data. Routine NOAA daily estimates of region areas (from Ramey observations) are given by different the different symbols. To avoid confusion we have reduced the areas of 8174 and 8176 by a factor of two. Figure 2: Time series of Growth. The time series shows the sudden growth of region 8179. The MDI sub-images are each 286” X 162” in area. The spot group grew rapidly just at the time of central meridian passage, with most of the area growth taking place on March 14. This gives us an optimum comparison between physical growth and area change via geometrical effects (foreshortening). 2. PSI and PFI model The effects of sunspots and faculae on the TSI are often modeled via the use of a PSI (Photometric Sunspot Index; see Hudson et al., 1982) and PFI (Photometric Facular Index; see Chapman and Meyer, 1986; Chapman, 1987). The essential idea of these indices is to make use of image data to characterize the active-region effects. 3. The area/TSI correlation We make the PSI and the PFI corrections for all regions but 8179. The result of the correlation is shown in the Figure 5 below. The first branch, with a slope of -0.79 for a linear fit, is the growth phase of the sunspot with decreasing TSI; the second, with a slope of -0.89, is the recovery, dominated by rotation and foreshortening of the sunspot group as it approaches the limb. We suggest that the discrepancies from proportionality result from uncertain corrections, but other physical effects cannot be ruled out. The basic result of our analysis shows that the rapid growth of a large sunspot group has no apparent thermal effects that we can detect via TSI measurements. Figure 3: PSI and PFI. Top panel: PSI of all active regions calculated from the MDI white-light images (110 over this time span). Bottom panel: PFI calculated from 8 Ca II images obtained from Big Bear Solar Observatory. Figure 5. The Correlation. The correlation between PSI and TSI in its two branches. The growth phase is plotted with triangles pointing upwards in the left panel and the decline phase (mainly foreshortening) is plotted with triangles pointing downwards in the right panel. Figure 4: TSI Correction. The solid line shows the TSI as a function of time. The dashed line shows the TSI corrected for both PSI and PFI contributions. The darkening of the active regions subtracts from the TSI so the PSI is added to the TSI whereas the PFI contributes positively, therefore it is subtracted out. 4. Transient Bright Rings We did a rudimentary search direct search in the white-light images for contemporaneous thermal effects. The idea is that a luminous “transient bright ring” would appear on small spatial scales at the time of sunspot eruption, as a direct result of flows associated with the eruption. The bright ring would result from sunspot growth, so we model its time history by differentiating the area increase and then fitting it with a Gaussian. We investigate the local region around AR 8179 by considering the image histogram in the MDI image sub-region as shown in figure 1. If we suppose that our model crudely describes the behavior of the transient bright ring then we must find the amplitude for our Gaussian fit that would allow us to see such an effect. The bright ring effect appears as a brightening of some pixels and produces a time-series effect in the image histogram. We superpose the Gaussian fit to the time-series of the histogram. A model amplitude that allows us to witness this effect gives an estimated limit on the energy. From this analysis we get a upper limit of the bright ring energy on order ~1034 ergs. Conclusion We have studied an isolated large sunspot group that grew rapidly at disk center, searching in two ways for irradiance changes that might be associated with the physical action of sunspot formation. It does not seem implausible that transient luminosity effects should exist, since it is generally accepted that sunspot fields result from the emergence through the photosphere of buoyant flux tubs, which involves flows and gravitational energy. We find that the correlation between sunspot area (via PSI) and the total solar irradiance matches during the two distinct phases, which represent actual physical growth and purely geometrical foreshortening respectively. In principle, a thermal effect should be expected to occur during the growth phase, because of the energy involved in buoyancy and in magnetic effects. This therefore represents an independent test of theories of thermal energy redistribution in the upper convection zone. Our observational result is an upper limit on the magnitude of this effect, which for a sunspot of this size and rapidity of growth could be detectable in TSI in the absence of rapid convective dissipation of the excess energy. The lack of an observable effect thus tends to confirm the correctness of the standard theory (Spruit). This theory will break down eventually on small spatial scales and short time scales, so high-resolution observations should be a focus of future searches. Figure 6. Model of a Transient Bright Ring. This figure shows the sum of the pixels above the quiet-sun level. The hypothetical transient bright ring, according to our crude model, would show up as a signal proportional to the time profile shown in Figure 1. Because of the noise in the intensity time distribution we choose a conservative limiting peak amplitude.