Download
1 / 12
120 likes | 206 Views
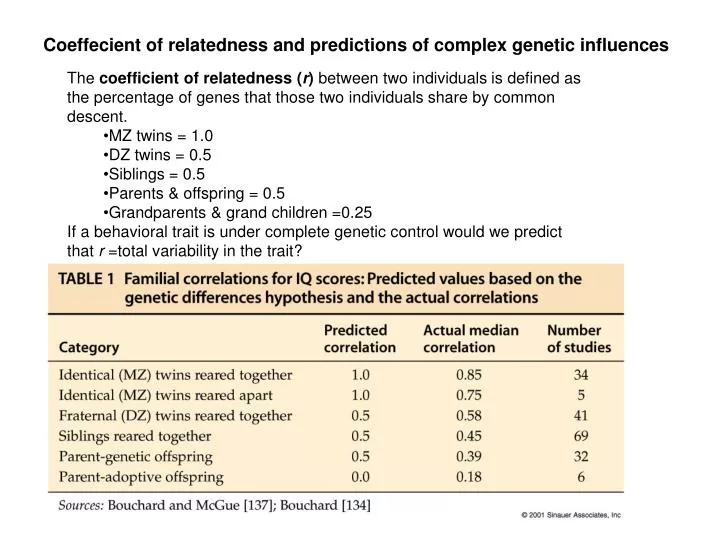
Coeffecient of relatedness and predictions of complex genetic influences. The coefficient of relatedness ( r ) between two individuals is defined as the percentage of genes that those two individuals share by common descent. MZ twins = 1.0 DZ twins = 0.5 Siblings = 0.5

E N D
Coeffecient of relatedness and predictions of complex genetic influences • The coefficient of relatedness (r) between two individuals is defined as the percentage of genes that those two individuals share by common descent. • MZ twins = 1.0 • DZ twins = 0.5 • Siblings = 0.5 • Parents & offspring = 0.5 • Grandparents & grand children =0.25 • If a behavioral trait is under complete genetic control would we predict that r =total variability in the trait?
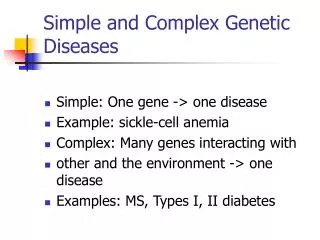
Two major approaches used by behavior geneticists to study relative contributions of genes & environment in the development of behavior • Hold genetic make-up constant to study effects of the environment alone (VT=VE) • cross-fostering experiments & twin studies • Hold environment constant & explore effects of genes alone (VT=VG) • selective breeding experiments • use of genetic “knock-outs” • Keep in mind: • Genetic effects are usually complex, involving Pleiotropic and Polygenic effects • Environmental effects are complex involving multiple environmental factors • Complex genetic and environmental effects will be further complicated by gene/environment interactions. Taken from Personality and Individual Differences, Vol. 23, No. 1 (July 1997), pp. 169-180
Heritability: • A measure of how strongly a phenotype is influenced by genetics • Total phenotypic variation=VT=VG+VE+VI • where: VT= total phenotypic variation observed in a (behavioral) traitVG= variation in population due to genotypeVE =variation in population due to environmentVI = variation in population due to interaction of VG with VE(i.e. VGxVE) Heritability (H2) H2=VG/(VG+VE+VI) = VG/VT • Characteristics of H2 • Heritability is standardized variance ranging from 0.0-1.0 • Indicates what fraction of the total variance in a trait is due to variation in genes: • H2=0: None of the variance in the trait is influenced by genes • H2=1: All of the variance in the trait is determined by genes Taken from Personality and Individual Differences, Vol. 23, No. 1 (July 1997), pp. 169-180
Philippe Rushton Primary research interest is altruism and social learning of generosity More controversial is on race differences
Heritability (H2) of IQ = 0.70 Average IQ by Ethnic group: African Americans 85 Latino 89 White 103 Asian 106 Jewish Americans 115 • Correlation between IQ and head/brain size = • 0.40 (MRI normal adults) • 0.24 (MRI clinical adults) Taken from Personality and Individual Differences, Vol. 23, No. 1 (July 1997), pp. 169-180
Brain size Brain size and race • Brain size and SES • Men • Unskilled 1,324cc • Professional 1,468cc • Women • Unskilled 1256cc • Professional 1264cc • Brain size and sex • Men 1325g • Women 1144g • ***However no difference in IQ ??? Taken from Personality and Individual Differences, Vol. 23, No. 1 (July 1997), pp. 169-180
1 of 6 warbler species that regularly winter in the British Isles, 4 of which are migratory Chiffchaff, Blackcap, Firecrest and Goldcrest winter Atlas 1981-1984, estimates 3,000 Blackcaps