Download
1 / 15
150 likes | 154 Views
Learn how to seamlessly combine controlled content and Weave visualizations to create interactive and informative data displays. This presentation by David Percy, Geospatial Data Manager at PSU Institute for Metropolitan Studies, will explore the use of geospatial data in the Greater Portland Vancouver Indicators Regional Equity Atlas and other projects. Topics covered include data architecture geometries, attribute data, controlled content, taxonomies, eight categories, cross-cutting relationships, and modular Weave visualizations. The talk will also touch on the use of web services, such as WMS and WFS, for sharing data with participating agencies.

E N D
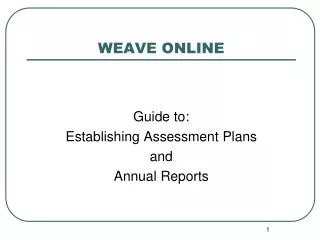
Integrating Controlled Content with Weave Visualizations David Percy Geospatial Data Manager PSU Institute for Metropolitan Studies NNIP 2011 Spring- Detroit I would have written a shorter letter, but I did not have the time. - Blaise Pascal
Greater Portland Vancouver Indicators Regional Equity Atlas PSU Data Commons Ecodistricts Assessment Tools Other, including Teaching and Research
Data Architecture Geometries: Census Tract Zip code Neighborhood, Etc… Each with a unique geometry id Attribute data: Geom_ID Attribute_1 Attribute_2 Attribute_N Examples: poverty, education, etc
Controlled Content • Ability to have a pre-defined set of fields that are filled in for a TYPE of content page. • In this case I defined an Indicators Type of page with a specific set of fields that come from our Indictor Sheets, which are also used for outreach.
The magic incantation • <iframe src="https://arctest.research.pdx.edu/weave/weave.html?defaults=cost_burdened_housing.xml" width="100%" height="800"></iframe>
Taxonomies • Hierarchical lists of terms related in some way • Used as “Tags” to categorize content • Common examples: Linnaean biological systems, Dewey Decimal, etc • Cf. Ontologies
Eight Categories • No surprises here: • Access and Mobility • Arts and Culture • Civic Engagement • Economic Opportunity • Education • Healthy Natural Environment • Healthy People • Housing and Communities • Safe People
Cross-cutting relationships • Hexagonal tesselations • Indicators can fit in multiple categories
Modular Weave visualizations • Each indicator visualization is created in Weave without “decoration”, no text description • This allows the visualization to be used in multiple pages or applications • Explanation of data is left to the containing page.
Web Services • In order to share data with participating agencies, we use Open Geospatial Consortium (OGC) web services. • WMS and WFS are the winners • That’s a whole ‘nuther talk! • Thanks!