Download
1 / 20
200 likes | 333 Views
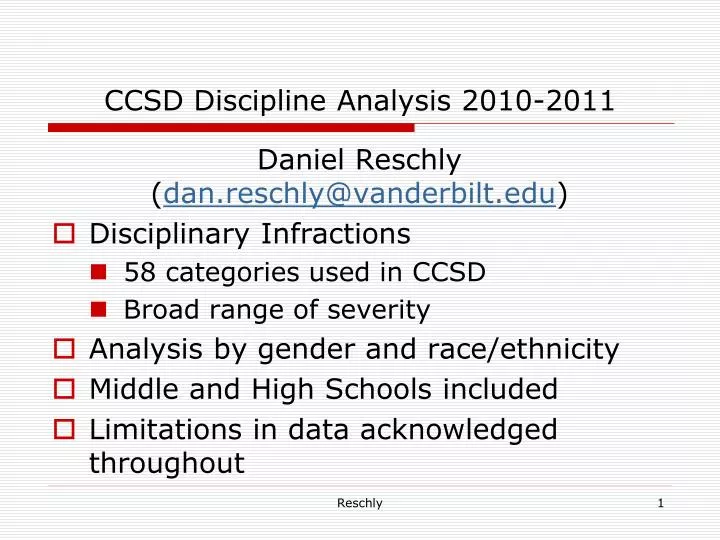
CCSD Discipline Analysis 2010-2011. Daniel Reschly ( dan.reschly@vanderbilt.edu ) Disciplinary Infractions 58 categories used in CCSD Broad range of severity Analysis by gender and race/ethnicity Middle and High Schools included Limitations in data acknowledged throughout. Analyses.

E N D
CCSD Discipline Analysis 2010-2011 Daniel Reschly (dan.reschly@vanderbilt.edu) • Disciplinary Infractions • 58 categories used in CCSD • Broad range of severity • Analysis by gender and race/ethnicity • Middle and High Schools included • Limitations in data acknowledged throughout Reschly
Analyses • Statistics used • N=Number • Risk=Percent of population • Relative Risk=Risk of one group compared to the combined risk for other groups • Composition Reschly
Problems with Interpretation of Composition Hispanic students are 15% of the district enrollment, but 30 percent of the discipline infractions. What percent of Hispanics are charged with disciplinary infractions 1% 5% 10% 15% 30% 45% Reschly
Relative Risk Determination: Comparing the risk for one group to the combined risk for all other groups (See p. 8-9) Black Aggressive Behavior Black Population 173 ÷ 20744 (5+15+180+8+30+186)÷(1367+12290+63125+2051+7007 +52972) Combined Population for 6 groups=138,812 Combined aggressive Behaviors for 6 groups=424 173 ÷ 20744 424 ÷ 138812 = 2.7 Relative Risk=2.7 Reschly
Infractions Leading to Suspension (note limitation) • Male students overrepresented at >2 in 33 of 58 disciplinary infractions • Females in one (cyber bullying) • Black students in 22 of 58 • Hispanic in 2 • Other groups not overrepresented Reschly
Infractions Leading to Suspension (note limitation, See Table 4 and p. 19) • Likelihood of Suspension by Group (Table 4 with summary on p. 19) • Hispanic more likely in 6 infractions • White students in 5 infractions • American Indian/AK Native in 2 infractions • Black in 2 infractions • ≥2 Groups in 2 infractions • Hawaiian/PI in 1 infraction • Summary: Black students have higher rates of infractions, but are not more likely to be suspended than other groups Reschly
School Withdrawal Outcomes • Most serious-involve change of school location and interruption of instruction • Mandatory Behavior Program: Moved to alternative education program for 4-9 weeks, can return to original school • Expulsion Modified to Conditional Enrollment: Expulsion referral modified to placement in a mandatory behavior program-return to comprehensive campus • Expulsion Board Action: Expelled for minimum of 18 weeks, placement in the continuation school, followed by trial enrollment in a comprehensive campus Reschly
Summary Disciplinary Outcomes Middle and High Schools 2010-2011 Reschly
Analyses by Disciplinary Outcomes by School Level and CCSD Area • School Level: Generally, disproportionate at both levels by gender and race/ethnicity • CCSD Areas levels of disproportionality were generally consistent, disproportionality by gender and race/ethnicity found consistently in Areas 1, 2, and 3 • Substantial overrepresentation of students with disabilities by gender and race/ethnicity Reschly
Interpretation of Results • Significant Issue Needing Attention!! • Analyze carefully potential explanations • Avoid extreme conclusions and simple explanations Avoid Extremes Blame Kids and Community Blame Schools and Educators Reschly
Identify Additional Information and Explore Interventions Needed • Change culture and expectations for both schools/educators and parents/students/community • Prevention and Early Intervention • Reading • Mathematics • Behavior • Explore programs like Positive Behavior Supports and Safe and Civil Schools Reschly
Limitations of Discipline Outcome Results • Limited to middle and high schools • Do not have reasons for school withdrawal disciplinary outcomes • Desirable to have data by both gender and race/ethnicity for more precise analysis • Summarized only 1 school withdrawal per student, e. g., in mandatory behavior and expulsion-conditional enrollment counted as 1 case • No equal treatment comparison data • Subject to different interpretations Reschly
Systematic Process of Change • Good baseline data • Goals, systematic improvement over time • Challenging, realistic, achievable • Public reporting by CCSD units • Alliance of community, students, schools, and teachers required Reschly
Figure 5. Mathematics Proficiency Goal and Progress Percent Proficient Goal: Raise Proficiency by 5% per year Baseline: Average of Prior 5 years Reschly
KTG: Initial Sound Fluency Fall to January . Benchmark: Winter KTG 25 sounds correct/min. Results for class are not satisfactory Must improve curriculum, instruction or both Water Line New KTG Teacher and Traditional Instruction On all class-wide graphs look at level and progress Reschly
KTG: Initial Sound Fluency Fall to January Benchmark: Winter KTG 25 sounds correct/min. Results for class are satisfactory. Can Use results to assess individual student risk Water Line Experienced Teacher Direct Instruction Reschly
Phoneme Seg. Fluency: Jan to May Benchmark: 35 correct Results for class are not satisfactory. Must improve curriculum, instruction or both Water Line New KTG Teacher and Traditional Instruction Reschly
Phoneme Seg. Fluency: Jan to May Benchmark: May 35 per minute Water Line Experienced Teacher Direct Instruction Results for class are satisfactory. Can Use results to assess individual student risk Reschly