Download
1 / 20
200 likes | 257 Views
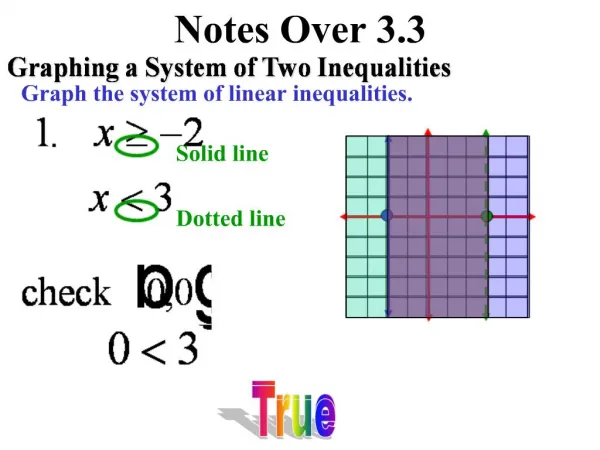
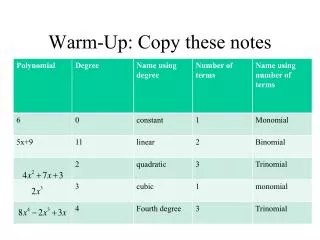
Warm-up with 3.3 Notes on Correlation. The fat and calorie contents of 5oz of 3 kinds of pizza are represented by the data points (9, 305), (11, 309) and (13, 316). Plot the points. (your graph may have a break along the y-axis)

E N D
Warm-upwith 3.3 Notes on Correlation The fat and calorie contents of 5oz of 3 kinds of pizza are represented by the data points (9, 305), (11, 309) and (13, 316). • Plot the points. (your graph may have a break along the y-axis) • Draw a line of best fit by hand and come up with the equation. (y = mx + b) • Determine the meaning of the slope and y-intercept in this situation. • Make a prediction as how many calories would you think a 15 gram 5oz piece of pizza would have, using your formula from b. • Enter the data in L1 and L2 and use the LineReg (ax+b) function to come up with the LSRL for the data.
Answers to Warm-up (9, 305), (11, 309) and (13, 316)
Answers to A.P. Statistics H.W. 3.2 P#3 and 5, E # 9 and 11 P3. As the school year progresses the student’s eraser weighs less (gets smaller). The eraser originally was 91.5 g (y-intercept) and it decreases at a rate of about 1 gram/80 days (slope). P5. a) The explanatory variable is the student/faculty ration. The response variable is the % of alumni giving. b. Two points on the line are (10, 35) and (15, 25). These are not data points but points on the line itself. If I used these to find slope it result in c. The y-intercept has no use because there would not be a situation where the student to faculty ratio would be zero.
A.P. Statistics Answers continued E #9 and 11 E 9. a. I. – E, II. – C, III – A, IV – D, V – B b. I – A, II – E, III – B, IV – D, V - C E 11. a. Theslope is about 2.5 inches a year b. The height of boys tend to be 2.5 inches/ year from ages 2 to 14. c. Depending on the point plugged in, if age 3 was plugged in the resulting equation would be height = 2.5(years) + 31.5 D. A y-intercept of 31.5 would mean that the median height of a newborn is 31.5 inches.
Statistics 3.1 H.W. Answers continued… E3. a. IIb.IVc.IIId. I E5. a. i. Plots A, B, and C appear the most linear. ii. Plots A, B, and C appear to have one cluster, Plot D has about two. iii. Plots A and C appear to have possible outliers. b. Plots and A and C have positive trend. Plot B displays a negative trend.
Remaining Statistics 3.1 h.w. Answers c. Plot A appears to show the strongest relationship. Plot C shows a possible strong relationship as well. d. I believe if they chose different universities the may show slightly weaker correlations. e. For Plot A, the schools with better graduation rates, would more likely product alumni that will donate later. Plot C, if SAT I scores are higher, these students are more likely better prepared to complete college requirements for graduation.
Statistics – Looking at the residual plot.Add this to your 3.2 notes on Getting a line. =_____ _____
End of 3.2 Beginning of 3.3 on Correlation Least Squares Regression Line (LSRL), also least squares line or regression line where the SSE is as small as possible. The properties of LSRL: 1)The sum and mean of residuals = 0. 2) The line contains the point averages . ***pg 125 has the rest 3) Most importantly the slope is: The equation is: Slope from the correlation coefficient and standard deviation.
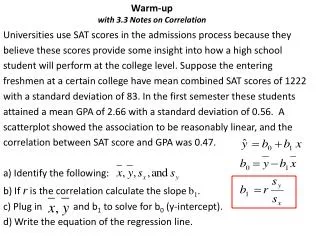
Calculating the LSRL step-by-step A high school counselor wants to see if there is a correlation between GPA and SAT score. Here are some of the data the guidance counselor is looking at. Sum: _____ _____ _____ ______ _______ _______ Mean: ____ _____ _____ _____ to find the bo substitute ( )
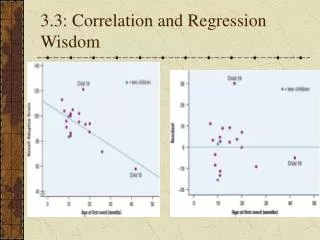
3.3 Correlation Correlation tells you the strength of the trend. OR r2 is the coefficient of determination. It is the proportion of variation of the response variable that can be explained by the explanatory variable.
Finding Correlation Coefficient on the Calculator • In order to find r (correlation coefficient) on your calculator. • We need to change it from the factory setting by going to CATALOG (Hit 2nd the 0 zero). • When in CATALOG your keys are automatically in Alpha so hit x-1 (where the Green D is located) • Scroll down to DiagnosticOn and press Enter twice! Practice: Speed: 20 30 40 50 60 MPG: 24 28 30 28 24 STAT -> Calc Scroll down to LinReg(ax+b) Enter LineReg(ax +b) L1, L2, Y1 Enter Notice you get both r and r2! Any theories about the r in this problem? Look at the graph.
A.P. Statistics H.W. Assignment • Copy formulas and definitions for 3.3 in your vocabulary/formula section of your notebook • Review your notes and calculator steps for 3.1 to 3.3 Quiz next class. • Opportunity for a 10 point bonus on the Activity we are completing October 21st. Bring a bag of small wrapped candy. (round or square) You will get a 10 pt bonus on the activity if you bring a bag. Bring it next class! NO CHOCOLATE!
Statistics H.W. • 3.2 P # 3 and 5, E#9 and 11. • Copy formulas and definitions for 3.3. • Print out calculator notes soon! • You will need them for the quiz on 3.1 to 3.3 October 21st Friday!