Download
1 / 1
10 likes | 136 Views
T21C-1981 Estimating Earth's Heat Flux Will Gosnold, Department of Geology and Geological Engineering University of North Dakota willgosnold@mail.und.edu. [2] Hydrothermal Circulation

E N D
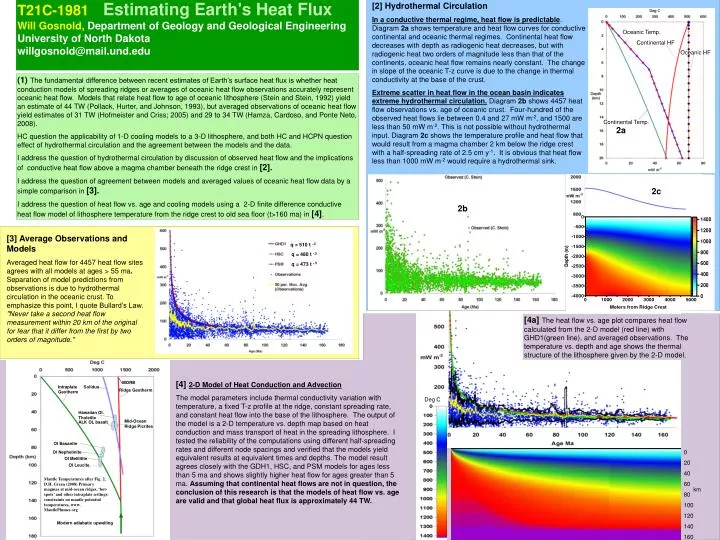
T21C-1981Estimating Earth's Heat FluxWill Gosnold, Department of Geology and Geological Engineering University of North Dakota willgosnold@mail.und.edu [2] Hydrothermal Circulation In a conductive thermal regime, heat flow is predictable. Diagram 2a shows temperature and heat flow curves for conductive continental and oceanic thermal regimes. Continental heat flow decreases with depth as radiogenic heat decreases, but with radiogenic heat two orders of magnitude less than that of the continents, oceanic heat flow remains nearly constant. The change in slope of the oceanic T-z curve is due to the change in thermal conductivity at the base of the crust. Extreme scatter in heat flow in the ocean basin indicates extreme hydrothermal circulation. Diagram 2b shows 4457 heat flow observations vs. age of oceanic crust. Four-hundred of the observed heat flows lie between 0.4 and 27 mW m-2, and 1500 are less than 50 mW m-2. This is not possible without hydrothermal input. Diagram 2c shows the temperature profile and heat flow that would result from a magma chamber 2 km below the ridge crest with a half-spreading rate of 2.5 cm y-1. It is obvious that heat flow less than 1000 mW m-2 would require a hydrothermal sink. Oceanic Temp. Continental HF Oceanic HF (1)The fundamental difference between recent estimates of Earth’s surface heat flux is whether heat conduction models of spreading ridges or averages of oceanic heat flow observations accurately represent oceanic heat flow. Models that relate heat flow to age of oceanic lithosphere (Stein and Stein, 1992) yield an estimate of 44 TW (Pollack, Hurter, and Johnson, 1993), but averaged observations of oceanic heat flow yield estimates of 31 TW (Hofmeister and Criss; 2005) and 29 to 34 TW (Hamza, Cardoso, and Ponte Neto, 2008). HC question the applicability of 1-D cooling models to a 3-D lithosphere, and both HC and HCPN question effect of hydrothermal circulation and the agreement between the models and the data. I address the question of hydrothermal circulation by discussion of observed heat flow and the implications of conductive heat flow above a magma chamber beneath the ridge crest in [2]. I address the question of agreement between models and averaged values of oceanic heat flow data by a simple comparison in [3]. I address the question of heat flow vs. age and cooling models using a 2-D finite difference conductive heat flow model of lithosphere temperature from the ridge crest to old sea floor (t>160 ma) in [4]. Continental Temp. 2a 2c 2b [3] Average Observations and Models Averaged heat flow for 4457 heat flow sites agrees with all models at ages > 55 ma. Separation of model predictions from observations is due to hydrothermal circulation in the oceanic crust. To emphasize this point, I quote Bullard’s Law. "Never take a second heat flow measurement within 20 km of the original for fear that it differ from the first by two orders of magnitude." q = 510 t -.5 q = 480 t -.5 q = 473 t -.5 [4a] The heat flow vs. age plot compares heat flow calculated from the 2-D model (red line) with GHD1(green line), and averaged observations. The temperature vs. depth and age shows the thermal structure of the lithosphere given by the 2-D model. [4] 2-D Model of Heat Conduction and Advection The model parameters include thermal conductivity variation with temperature, a fixed T-z profile at the ridge, constant spreading rate, and constant heat flow into the base of the lithosphere. The output of the model is a 2-D temperature vs. depth map based on heat conduction and mass transport of heat in the spreading lithosphere. I tested the reliability of the computations using different half-spreading rates and different node spacings and verified that the models yield equivalent results at equivalent times and depths. The model result agrees closely with the GDH1, HSC, and PSM models for ages less than 5 ma and shows slightly higher heat flow for ages greater than 5 ma. Assuming that continental heat flows are not in question, the conclusion of this research is that the models of heat flow vs. age are valid and that global heat flux is approximately 44 TW. MORB Intraplate Geotherm Solidus Ridge Geotherm Deg C Hawaiian Ol. Tholeiite Mid-Ocean Ridge Picrites ALK OL basalt Ol Basanite 0 20 40 60 80 100 120 140 160 Ol Nephelinite Ol Melilitite Ol Leucite Mantle Temperatures after Fig. 2, D.H. Green (2008) Primary magmas at mid-ocean ridges, ‘hot-spots’ and other intraplate settings: constraints on mantle potential temperatures, www. MantlePlumes.org km Modern adiabatic upwelling