Download
1 / 4
40 likes | 132 Views
Hits of VTX detector. Jun06 のときは VTX で複数回 hit が書かれていた。修正した結果、 tolerance を下回る結果となった。. jun06. 今回. 10 bunch data を使用。 1 train = 2820 bunch としている。. VTX の tolerance は 1*10^4 hits/cm^2/train なので、いずれの Layer でも下回っている。. 各 Layer ( 1~3 )の hit の z 分布. Layer 1. Layer 2. Layer 1 hit の内訳. Layer 3.

E N D
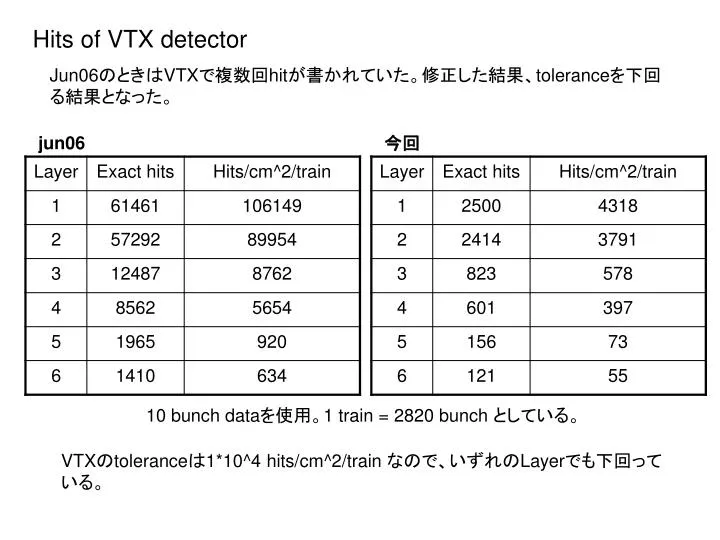
Hits of VTX detector Jun06のときはVTXで複数回hitが書かれていた。修正した結果、toleranceを下回る結果となった。 jun06 今回 10 bunch dataを使用。1 train = 2820 bunch としている。 VTXのtoleranceは1*10^4 hits/cm^2/train なので、いずれのLayerでも下回っている。
各Layer(1~3)のhitのz分布 Layer 1 Layer 2 Layer 1 hitの内訳 Layer 3
Layer 1のpdgcodeごとのz分布 pdgcode 11 一方から電子が、もう一方から陽電子が来て衝突させた結果のCAINのデータを使っているので、電子と陽電子でヒストグラムは左右対称な形になるかと思っていたが、その傾向は無かった。 pdgcode -11
まとめ ・VTXのすべてのLayerでtoleranceを下回った。 ・z分布を見ると、|z|が大きいところでhitが多いことが確認できた。 ・電子、陽電子でz分布の違いは見られなかった。