Download
1 / 12
120 likes | 266 Views
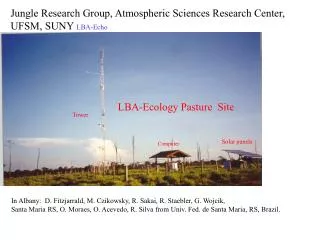
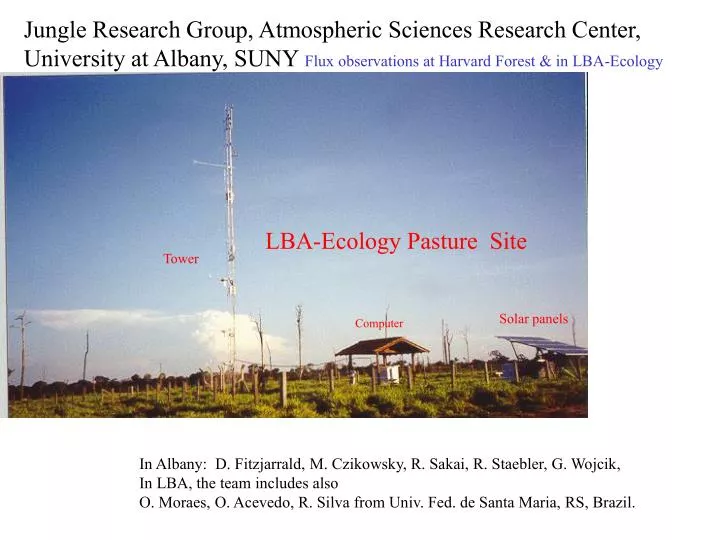
Jungle Research Group, Atmospheric Sciences Research Center, University at Albany, SUNY Flux observations at Harvard Forest & in LBA-Ecology. LBA-Ecology Pasture Site. Tower. Solar panels. Computer. In Albany: D. Fitzjarrald, M. Czikowsky, R. Sakai, R. Staebler, G. Wojcik,

E N D
Jungle Research Group, Atmospheric Sciences Research Center, University at Albany, SUNY Flux observations at Harvard Forest & in LBA-Ecology LBA-Ecology Pasture Site Tower Solar panels Computer In Albany: D. Fitzjarrald, M. Czikowsky, R. Sakai, R. Staebler, G. Wojcik, In LBA, the team includes also O. Moraes, O. Acevedo, R. Silva from Univ. Fed. de Santa Maria, RS, Brazil.
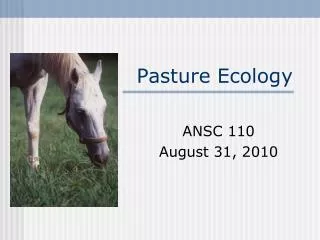
Tethered balloon study of CO2 and water vapor accumulation In the stable boundary layer. July 2001 (2nd phase October 2001) Balloon profiling done by the UFSM team. L. to R: Otávio Acevedo, Rodrigo. da Silva, and Osvaldo Moraes Original inhabitants of field visit Acevedo.
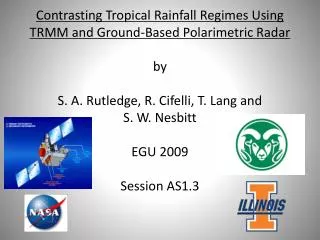
Morning of July 30, 2001, LBA-Pasture site, Santarém PA, Brazil Looking east at dawn Looking NNE, (outhouse in foreground).
Sequences of Pot. Temp., specific humidity, wind speed & direction. Soundings: 2125, 2230, 2342, 0035, 0140, 0202, 0334, 0427, 0526 Urubu Balloon Soundings: 0611, 0618, 0625, 0632, 0645, 0655, 0717, 0804, 0838 The urubu (vulture) soars at 8:52am, Verifying convective conditions.
q follows T down at night 30 July CO2 begins rise at Kdn = 160 W/m2 Nocturnal fluxes negligible
July 30, 2001 Nocturnal eddy CO2 flux: Accumulation of CO2 (flux units) Now, we have sodar operating for long periods. Will be able to report on 15 months of continuous operations soon. [CO2] starts down only about 10am LT.