Download
1 / 21
210 likes | 369 Views
Joint Eurostat-UNECE Work Session on Demographic Projections INE - Lisboa (Portugal) , 28-30 April 2010 . Methodological issues of population projections in small States the case of Cape Verde. BRITO, Pedro d2008274@isegi.unl.pt RODRIGUES, Teresa trodrigues@isegi.unl.pt.

E N D
Joint Eurostat-UNECE Work Session on Demographic Projections INE - Lisboa (Portugal) , 28-30 April 2010 Methodologicalissues of populationprojectionsinsmallStatesthe case of Cape Verde BRITO, Pedro d2008274@isegi.unl.pt RODRIGUES, Teresa trodrigues@isegi.unl.pt
Methodological issues of population projections in small States. The case of Cape Verde Main Issue: Republic of Cape Verde To discuss possible alternative methods of performing population projections in small political independent States (To consider Cape Verde and its 10 islands as a case study)
Methodological issues of population projections in small States. The case of Cape Verde 3 Methodological assumptions • To project Cape Verde’s population evolution for 2000-2025, based on different methods; • To present some hypothetical demographic “scenarios”, both for total and insular population • To make a critical analysis of the results obtained
Methodological issues of population projections in small States. The case of Cape Verde 4 Our Goal • To make some aggregation tests of the 10 existing islands, according to their convergence or divergence behavior patterns (both natural and/or migratory). • To verify the probable existence of future different internal (insular) trends / “local histories”
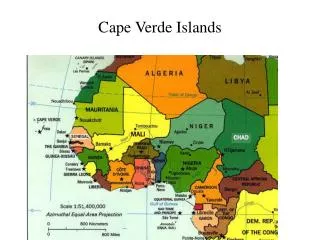
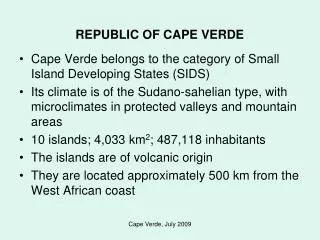
Starting points Data analysis becomes increasingly complex as the size of the projected population decreases • Cape Verde is no exception to this rule • an insular Country, located in the Atlantic Ocean in the West African coast • composed by 10 islands and several islets and divided in 22 municipalities • a micro-island State with less than half a million inhabitants (Census 2000: 431989)
6 Starting points • Annual Average Increase Rate (1991-2000): 2.39% • extremely young population structure (42% under 15 years; 54% under 20 years) • Crude Birth Rate=29.5 ‰; Crude Mortality Rate=6.4 ‰; Infant Mortality Rate=33.3‰; General Fertility Rate=123.3 ‰; Synthetic Fertility Index=4.0 children/woman; Average Life Expectancy at Birth (M/F)=71 years; Mean Procreation Age=29 years • Huge internal diversity in natural and migratory behaviours
Methodological issues of population projections in small States. The case of Cape Verde 7 Methodologies • For this exercise we rely on the method of components (Cohort Survival) to present some hypothetical “scenarios”, based on the Census of 2000 and all demographic behaviors and its trend in the 1990s; • In subsidiary terms we used mathematical methods and ratio. The first one considers the average annual growth rate recorded in the 90’s to project population volume by 2025; the second estimates the same population based on the weight it had both in 1990 and 2000, compared to the population of ECOWAS.
8 Prospective Hypothesis: future demographic dynamics
Methodological issues of population projections in small States. The case of Cape Verde 9 National Results (1)
10 National Results, with and without migratory effect
Graphic 2: Cape Verde 2025 (Natural Trend) F M Birth’s year Birth’s year + 1900 1900 95 1910 90 1910 85 1920 1920 80 75 1930 1930 70 65 1940 1940 60 55 1950 1950 50 45 1960 1960 40 1970 35 1970 30 1980 25 1980 20 1990 1990 15 10 2000 2000 5 9 8 7 6 5 4 3 2 1 0 0 0 1 2 3 4 5 6 7 8 9 Graphic 1: Cape Verde 2000 (Natural Trend) F M Birth’s year Birth’s year + 1900 1900 95 1910 90 1910 85 1920 1920 80 75 1930 1930 70 65 1940 1940 60 55 1950 1950 50 45 1960 1960 40 35 1970 1970 30 25 1980 1980 20 1990 15 1990 10 2000 2000 5 0 9 8 7 6 5 4 3 2 1 0 0 1 2 3 4 5 6 7 8 9 11 Prospective Hypothesis: future demographic dynamics Cape Verde Population Structure – Natural Trend (2000 and 2025)
Graphic 4: Cape Verde 2025 (Alternative Trend) M F Birth’s year Birth’s year + 1915 1915 95 1925 90 1925 85 1935 1935 80 75 1945 1945 70 65 1955 1955 60 55 1965 1965 50 45 1975 1975 40 1985 35 1985 30 1995 25 1995 20 2005 2005 15 10 2015 2015 5 9 8 7 6 5 4 3 2 1 0 0 0 1 2 3 4 5 6 7 8 9 Graphic 3: Cape Verde 2000 (Alternative Trend) F M Birth’syear Birth’s year + 1890 1890 95 1900 90 1900 85 1910 1910 80 75 1920 1920 70 65 1930 1930 60 55 1940 1940 50 45 1950 1950 40 35 1960 1960 30 1970 25 1970 20 1980 1980 15 10 1990 1990 5 0 9 8 7 6 5 4 3 2 1 0 0 1 2 3 4 5 6 7 8 9 12 Prospective Hypothesis: future demographic dynamics Cape Verde Population Structure – Alternative Trend (2000 and 2025)
13 Prospective Hypothesis: future demographic dynamics
Methodological issues of population projections in small States. The case of Cape Verde 14 Main Conclusions • Micro-demographic variables, such as birth / fertility, mortality and migration rates are the most important factors for population growth in Cape Verde; • Mortality continues to decline at all age groups and islands, as a result of improvements in sanitation and socio-economic; • Life expectancy at birth increased significantly between 1990 and 2000; • Cape Verdean population will continue to grow in the near future, at least until 2025, no mater the chosen scenario.
Methodological issues of population projections in small States. The case of Cape Verde 15 Regional Results (2)
16 Population estimates for Cape Verde’s islands (2000-2025)
17 Population estimates for Cape Verde’s islands (2000-2025)
18 • From the demographic point of view there are 3 groups of Islands: • 1- Islands with a fast growth • Santiago ; São Vicente and Sal (Development Concentration Poles; moderate Fecundity + high migratory balance) • 2- Islands with a moderate growth • Fogo and Santo Antão (Sources of internal and international migrations; high Fecundity rates + negative migratory balance); • 3- Islands with a slow growth • Boavista; Maio; São Nicolau and Brava (Sources internal and international migrations ; small fecundity + very negative migratory balance)
19 • 4. Islands with very reduced populationand a very high probability error: • Brava - 6762 inhabitants • Boavista - 4178 inhabitants • Maio – 6713 - inhabitants
Methodological issues of population projections in small States. The case of Cape Verde 20 Main Conclusions • The more economic and social developed islands remain the major demographic poles of attraction (Santiago; Santa Catarina; São Vicente; Sal and Boavista in some ways); • Islands with higher fecundity rates are not the ones where growth rates are highest ; • Migrations (internal and international ones) represent the major importance to explain diferentials on populational dynamics; • Demographic projections at level of the municipalities are impossible or present major errors, as there are municipalities with vey small volumes of residents. • …