Download
1 / 17
360 likes | 723 Views
Graphing Inverse Functions . EQ: How do we graph functions and their inverses?. M2 Unit 5a: Day 4. Inverse Functions. The graph of an inverse relation is the reflection of the graph of the original relation. The line of reflection is y = x.

E N D
Graphing Inverse Functions EQ: How do we graph functions and their inverses? M2 Unit 5a: Day 4
Inverse Functions The graph of an inverse relation is the reflection of the graph of the original relation. The line of reflection is y = x. Remember… when given an equation with x and y, switch the roles of x and y and solve for y.
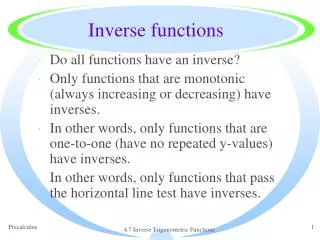
Horizontal Line Test The horizontal line test states that if NO horizontal line intersects the graph of a function more than once, then the graph is one-to-one If a function does not pass the HLT then the domain must be restricted in order to find the inverse.
Match…then tell if the function passes the horizontal line test. B. A. 1. 2. C. D. 3. 4. F. E. 5. 6. 1) F, 2) D , 3) A, 4) B, 5) E, 6) C
Use the Horizontal Line Test to determine if the function is one-to-one. B. A. no yes D. C. yes no
Using the HLT, which of the following functions requires a restricted domain in order to find the inverse? A. B. C. D.
Example 1: Find the inverse of the relation and graph it. Inverse:
Example 2: Find the inverse of the relation and graph it. Inverse:
Find the inverse of the function. Then graph both the function and its inverse using a table of values to show its reflection about the line y = x. Inverse: Function
Find the inverse of the function. Then graph both the function and its inverse using a table of values to show its reflection about the line y = x. Inverse: Function
Find the inverse of the function. Then graph both the function and its inverse using a table of values to show its reflection about the line y = x. Function Inverse:
The lightest line on each grid shows y=x. Which graph also shows the graph of f(x) = 2x and its inverse? A. B.
The lightest line on each grid shows y=x. Which graph also shows the graph of f(x) = 2x -1 and its inverse? A. B.
Restricted Domain Since a parabola does not pass the HLT, you can only use “part” of it. Which “part” could you still use to have the function pass the HLT? This is why we restrict the domain.
Homework: • Handout