Download
1 / 16
160 likes | 162 Views
This paper discusses the integration of visual analytics and discrete sciences for Centers of Excellence (COEs), focusing on the Center of Excellence for Natural Disasters, Coastal Infrastructure, and Emergency Management (DIEM). It explores 3D+ time visualization, infrastructure and terrain analysis, and event and group analysis through multimedia analysis. The paper also highlights the challenges and objectives of visualizing multivariate time-varying 3D data for comprehensive analysis.

E N D
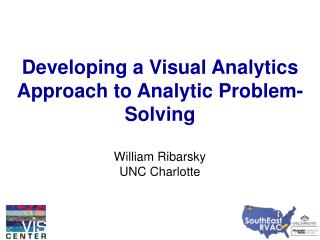
Integration of Visual Analytics and Discrete Sciences to COEs William Ribarsky Remco Chang University of North Carolina at Charlotte
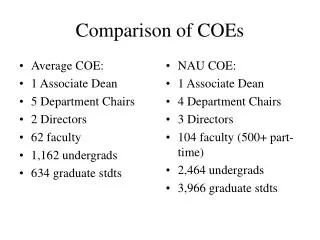
Supporting Other Centers of Excellence • Center of Excellence for Natural Disasters, Coastal Infrastructure, and Emergency Management (DIEM) • 3D + time visualization • Infrastructure and terrain + population • Center of Study of Terrorism and Response to Terrorism (START) • Analysis of the Global Terrorism Database (GTD) • Event, group, and social-political analysis through multimedia analysis
Center of Excellence for Natural Disasters, Coastal Infrastructure, and Emergency Management (DIEM) Problems • Multiple, time-dependent 3D fields (rain, hurricane wind fields, storm surge, flooding) • Analysis of coastal terrain changes due to natural and man-made effects • Analysis of coastal infrastructure, coastal cities, and their inhabitants These problems require visual analytics tools integrating interactive visualization with both application-focused and general analyses.
4D Feature-Based Data Analysis • Explore interactive rendering methods to combine the visualization of 3D datasets and abstract information for advanced analysis capabilities • Investigate an effective approach to visualize data correlations from multivariate time-varying datasets • Explore enhancement methods to highlight context-based 4D data features Morning (Left) and afternoon (right) of Nitrous Oxide over the Charlotte region from a run of the CMAQ model
4D Data Interaction • Develop task-driven methods to assist and accelerate important visualization and analysis processes • Integrate all the functions in a visualization environment and specialize it for models, such as storm surge and hurricane weather, that are interests to the center.
UrbanVis (Tools for Cross-Analyzing Urban Infrastructure and Urban Populations)
Multi-Focus Comparison • Interaction with multiple ROIs • Clear relationships • - Annotation: • - InfoVis panels glyphs
DHS START Center: Global Terrorism Database WHO – Terrorist Groups Five Flexible Entry Components What WHERE~ WHEN
Visual GTD Flow Chart Entity Relationships (Geo-temporal Vis) Dimensional Relationships (ParallelSets) Entity Analysis (Search By Example)
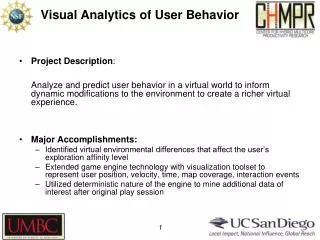
START Center: Event, Group, and Social-Political Analysis Opinion Analysis Framing and Viewpoint Analysis Geographic/Temporal Entity Extraction Comparative Event Trend Analysis
Planned CCI Center Integration • Natural disaster and flood visual analytics coupled with urban emergency planning and response. (DIEM) • Multimedia analytics for investigative analysis (including blogs, RSS feeds, online news, etc.) Useful for ICE, FinCEN, and other agencies. (START) • Automated analytical reasoning and investigative tools (RESIN, STAB, predictive human cognitive model) • Global terrorism and financial fraud analytics
Questions? www.srvac.uncc.edu www.viscenter.uncc.edu
DIEM: Multivariate Time-varying 3D Visualization • Multiple, time-dependent 3D fields • Challenges: large data amount and complex data relations • Objectives: Visualize, analyze, and represent in an integrated environment • Ultimately, comprehensive view of storm surge and hurricane weather models together over coastal terrain
Enter System by single or multiple Selections System will supply Specific Information Drilldown to Original Info