Download
1 / 32
320 likes | 488 Views
MAP and the Maintenance Backlog. Chris Christopher Director of Maintenance Operations. WASHTO Maintenance March 8, 2010. Characteristic: Result: Competence Confidence Consistency Trust Respect Respect Civility Rapport. Here’s what was happening…. The Downward Trend:.

E N D
MAP and the Maintenance Backlog Chris Christopher Director of Maintenance Operations WASHTO Maintenance March 8, 2010
Characteristic:Result: Competence Confidence Consistency Trust Respect Respect Civility Rapport
The Downward Trend: • New stuff • Inflation • New requirements(i.e. stormwater) • Increased expectations (i.e. snow and ice control) • No additional money • Inability to effectively make our case for additional resources
Priorities What are we about? What is most important to us? Does it match how we spend our money? Budget Requests Delivery What work are we doing today? The person in the field ? Performance Measures Consistent with our priorities and our budget requests? MAP 1 is not a direct measure of what we deliver
Alignment is Critical Priorities What are we about? What is most important to us? Does it match how we spend our money? Budget Requests Delivery What work are we doing today? The person in the field Performance Measures Consistent with our priorities and our budget requests?
Priorities • What’s our story? • What are we about?
WSDOT Highway Maintenance: • We operate the system – i.e. IR, S&I, Signals • We repair it when it breaks (unplanned) • We perform preventive maintenance (planned)(the backbone of the backlog) • We deliver the “political” piece (10%)
What the Audit Found: • No glaring waste, no “savings” identified • Maintenance funding has not kept up with increasing demands from system additions, etc. • Large and growing backlog of maintenance now exists • Some basic components in place (i.e. MAP, some small MMS, inventory) • Program cannot accurately identify the backlog at this time.
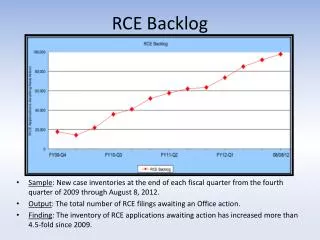
The Maintenance Backlog • What work should be done vs. what work actually got completed • The difference is the backlog • Original MAP study in 1995 indicated we need both MMS data and MQA data • But we weren’t set up to figure it out
Performance Measures MAP 1 Shortfalls: • Not a direct measure of work being done • Doesn’t predict failure very well. Reports failure after it happens • Difficult to make a compelling case for funding when still hitting targets • Indirect relationship between program investment and results • Overachieving/underachieving-$ on the table
MAP 1 to MAP 2 • MAP 1: Measures the outcome(i.e. the culvert is 50% full of sediment) • MAP 2: Measures the outputHow much is there to do? How much did we do? What didn’t get done? (becomes the backlog) You need them both (Duh)
2008 Maintenance Backlog Report • Current estimate for entire maintenance backlog is $85 million • First biennium payment is $16.8 million • Identify feature inventories • Optimal maintenance schedules • Track work accomplished • Work unit cost data • MMS to manage information
Alignment Getting the story straight in: Our Minds WSDOT Strategic Plan Secretary’s Perspective The Program GMAP Backlog Report Gray Notebook Eventually, leading to
2009-11 MAP Projected Delivery $16.8 million for maintenance backlog • $4 million for signals: Catch-up with 50% of backlog • $1.5 million for bridges: Catch up with repair backlog enough to achieve current MAP target • $0.9 million for regulatory signs: Catch up with maintenance backlog enough to achieve current MAP target • $3 million for ITS: Catch-up with 50% of backlog • $4 million for pavement maintenance: Keep up with increasing deterioration. • $0.7 million for cable guardrail: Catch-up with 100% of backlog • $1.2 million for raised/recessed pavement markers: Catch up with backlog enough to achieve current MAP target • $1.5 million for culvert maintenance: Catch-up with 60% of backlog to meet MAP target $761,000 for electricity cost increase $750,000 for stormwater compliance
What we’ve been up to lately: Reporting on the backlog Educating people on the link between“Maintenance Task Completion” and “Asset Condition”(the backlog)(the MAP Scores) Getting to the heart of what really drives asset condition
WSDOT’s MAP Story Maintenance Accountability Process MaintenanceTask Completion HighwayAsset AssetCondition 1996 MAP Study Maintenance Task Completion (Preventive Maintenance, Repairs, Utilities) Asset Condition (MAP Level of Service Scores)
WSDOT’s MAP Story Maintenance Accountability Process MaintenanceTask Completion HighwayAsset AssetCondition 1996 MAP Study Maintenance Task Completion (Preventive Maintenance, Repairs, Utilities) Asset Condition (MAP Level of Service Scores)
WSDOT’s MAP Story Maintenance Accountability Process MaintenanceTask Completion HighwayAsset AssetCondition 1996 MAP Study Maintenance Task Completion (Preventive Maintenance, Repairs, Utilities) Asset Condition (MAP Level of Service Scores) Highway Asset Condition 32 Highway Maintenance Assets Signals ITS Structural Bridge Pavement Culverts Guardrail (Cable) Regulatory Signs Pavement Markers
WSDOT’s MAP Story Maintenance Accountability Process MaintenanceTask Completion HighwayAsset AssetCondition 1996 MAP Study Maintenance Task Completion (Preventive Maintenance, Repairs, Utilities) Asset Condition (MAP Level of Service Scores) Highway Asset Condition 32 Highway Maintenance Assets A through F Level of Service Strategic Plan Targets SP Target Signals C+ ITS B- Structural Bridge C Pavement C+ Culverts C Guardrail (Cable) A Regulatory Signs C+ Pavement Markers B
WSDOT’s MAP Story Maintenance Accountability Process MaintenanceTask Completion HighwayAsset AssetCondition 1996 MAP Study Maintenance Task Completion (Preventive Maintenance, Repairs, Utilities) Asset Condition (MAP Level of Service Scores) Highway Asset Condition 32 Highway Maintenance Assets A through F Level of Service Strategic Plan Targets Current Condition = CY 2009 CY 2009 SP Target Signals C C+ ITS A- B- Structural Bridge D C Pavement C+ C+ Culverts D+ C Guardrail (Cable) B+ A Regulatory Signs D+ C+ Pavement Markers C B
WSDOT’s MAP Story Maintenance Accountability Process MaintenanceTask Completion HighwayAsset AssetCondition 1996 MAP Study Maintenance Task Completion (Preventive Maintenance, Repairs, Utilities) Asset Condition (MAP Level of Service Scores) Highway Asset Condition 32 Highway Maintenance Assets A through F Level of Service Strategic Plan Targets Current Condition = CY 2009 Declining Trend CY 2009 SP Target Signals C C+ ITS A- B- Structural Bridge D C Pavement C+ C+ Culverts D+ C Guardrail (Cable) B+ A Regulatory Signs D+ C+ Pavement Markers C B
WSDOT’s MAP Story Maintenance Accountability Process MaintenanceTask Completion HighwayAsset AssetCondition 1996 MAP Study Maintenance Task Completion (Preventive Maintenance, Repairs, Utilities) Asset Condition (MAP Level of Service Scores) Highway Asset Condition 32 Highway Maintenance Assets A through F Level of Service Strategic Plan Targets Current Condition = CY 2009 Declining Trend 2007 Performance Audit Introduce Task Completion Measure and Maintenance Backlog CY 2009 SP Target Signals C C+ ITS A- B- Structural Bridge D C Pavement C+ C+ Culverts D+ C Guardrail (Cable) B+ A Regulatory Signs D+ C+ Pavement Markers C B
WSDOT’s MAP Story Maintenance Accountability Process MaintenanceTask Completion HighwayAsset AssetCondition 1996 MAP Study Maintenance Task Completion (Preventive Maintenance, Repairs, Utilities) Asset Condition (MAP Level of Service Scores) Highway Asset Condition 32 Highway Maintenance Assets A through F Level of Service Strategic Plan Targets Current Condition = CY 2009 Declining Trend 2007 Performance Audit Introduce Task Completion Measure and Maintenance Backlog 2008 Backlog Needs & Funding $85 Million – 10 Year Plan (Existing) 2008 CY 2009 SP Target 37% Signals C C+ 13% ITS A- B- 42% Structural Bridge D C 66% Pavement C+ C+ 63% Culverts D+ C 50% Guardrail (Cable) B+ A 72% Regulatory Signs D+ C+ 59% Pavement Markers C B
WSDOT’s MAP Story Maintenance Accountability Process MaintenanceTask Completion HighwayAsset AssetCondition 1996 MAP Study Maintenance Task Completion (Preventive Maintenance, Repairs, Utilities) Asset Condition (MAP Level of Service Scores) Highway Asset Condition 32 Highway Maintenance Assets A through F Level of Service Strategic Plan Targets Current Condition = CY 2009 Declining Trend 2007 Performance Audit Introduce Task Completion Measure and Maintenance Backlog 2008 Backlog Needs & Funding $85 Million – 10 Year Plan (Existing) $16.8 Million Funded in 2009-11 $24.1 Million Planned in 2011-13 $22.7 Million Planned in 2013-15 $12.3 Million Planned in 2015-17 $9.0 Million Planned in 2017-19 2008 2009-11 CY 2009 SP Target 37% 69% Signals C C+ 13% 57% ITS A- B- 42% 49% Structural Bridge D C 66% 79% Pavement C+ C+ 63% 85% Culverts D+ C 50% 100% Guardrail (Cable) B+ A 72% 100% Regulatory Signs D+ C+ 59% 100% Pavement Markers C B
WSDOT’s MAP Story Maintenance Accountability Process MaintenanceTask Completion HighwayAsset AssetCondition 1996 MAP Study Maintenance Task Completion (Preventive Maintenance, Repairs, Utilities) Asset Condition (MAP Level of Service Scores) Highway Asset Condition 32 Highway Maintenance Assets A through F Level of Service Strategic Plan Targets Current Condition = CY 2009 Declining Trend 2007 Performance Audit Introduce Task Completion Measure and Maintenance Backlog 2008 Backlog Needs & Funding $85 Million – 10 Year Plan (Existing) $16.8 Million Funded in 2009-11 $24.1 Million Planned in 2011-13 $22.7 Million Planned in 2013-15 $12.3 Million Planned in 2015-17 $9.0 Million Planned in 2017-19 Growing Inventory & System Additions Additional Funds 2008 2009-11 CY 2009 SP Target 37% 69% Signals C C+ 13% 57% ITS A- B- 42% 49% Structural Bridge D C 66% 79% Pavement C+ C+ 63% 85% Culverts D+ C 50% 100% Guardrail (Cable) B+ A 72% 100% Regulatory Signs D+ C+ 59% 100% Pavement Markers C B
What Drives the Condition of Highway Assets • Preservation Program • Replace assets at end of useful life (lowest lifecycle cost) • Maintenance Program • Operate the system • Inspections • Preventive Maintenance • Repairs • Improvement Program • Add new assets to improve mobility and safety • Condition of Highway Assets • Measured deficiencies in highway assets • Level of Service Ratings Wear and tear from extended and prolonged use Damage from natural events (i.e. storms, earthquake) Added Inventory General deterioration over time (i.e. weather, corrosion) Damage from motor vehicle collisions
Applying Asset Management to : Pavements Bridges Drainage ITS/Electrical