Download
1 / 32
320 likes | 443 Views
Model Prediction and Evaluation Eric F. Wood Princeton University. DOE Workshop on Community Modeling and Long-term Predictions of the Integrated Water Cycle Washington, DC September 24-26, 2012. Workshop focus

E N D
Model Prediction and Evaluation Eric F. Wood Princeton University DOE Workshop on Community Modeling and Long-term Predictions of the Integrated Water Cycle Washington, DC September 24-26, 2012
Workshop focus “(the workshop participants) will be discussing challenges in predicting the water cycle and evaluating models that are used to do the predictions.” “what may be the most important obstacles or challenges in predicting water cycle changes in the future.”
Questions relevant to this presentation • What is the consistency among models in predicting the water cycle? • Can a framework be developed for water and energy cycle model evaluation? • Does adequate data exists for evaluating models, and if so where is it? • Can we develop models with improved predictive capabilities?
Some representative examples How consistent are predictions of water cycle variables? Estimates of water cycle variables over the pan-Arctic from observations, coupled GCMs, uncoupled LSMs, and remote sensing vary widely. (from Rawlins, et al “Analysis of the Arctic System for Freshwater Cycle Intensification”, in review)
Seasonal Water Budgets for N. American Regions from CMIP5 Soil Moisture Precipitation Runoff Evapotranspiration CMIP5 Models VIC off-line LSM Western NA Central NA Eastern NA • Soil moisture tends to wet too early in CMIP5 models and has larger dynamic range (deeper soils, more P, more E) • Precipitation is too high in the west • Evapotranspiration is generally too high, regardless of precip • Runoff is too low and spring melt peaks too early
Verification of Jul. 2012 forecast Verification of Aug. 2012 forecast Verification of Sept. 2012 forecast July 2012 initialized 7/1/2012 Aug. 2012 initialized 7/1/2012 Sept. 2012 initialized 7/1/2012 NOAA’S forecast model doesn’t hold drought conditions. WHY?
Comparisons of re-analysis derived, and observed, water cycle variables? The community has the belief that re-analysis derived model outputs (data sets) should be skillful since they assimilate a wide suite of observations from which the models predict water and energy cycle fluxes and states. Are these predictions consistent among models since most of the assimilated data sets are the same?
Basins where we have been focusing large-scale analysis of model performance.
How consistent are re-analysis derived, and observed, water cycle variables? The community has the belief that re-analysis derived model outputs (data sets) should be skillful since they assimilate a wide suite of observations from which the models predict water and energy cycle fluxes and states. Are these predictions consistent among models since most of the assimilated data sets are the same? These results and MANY OTHER STUDIES indicate significant differences among model predictions, and significant differences with observations. Is there a strategy for progress here?
How do atmosphere-land surface interactions operate and feed back onto the regional and larger scale climate system? Recent papers: Findell, K. L. & Eltahir, E. A. B. Atmospheric controls on soil moisture-boundary layer interactions. Part II: feedbacks within the continental United States. J. Hydrometeorol. 4, 570–583 (2003). Koster, R. D. et al. Regions of strong coupling between soil moisture and precipitation. Science 305, 1138–1140 (2004). Betts, AK 2004 Understanding hydrometeorology using global models” BAMS, 1673-1688, DOI:10.1175/BAMS-85-11-1673, November Ferguson, CR and Eric F Wood. 2011. Observed Land–Atmosphere Coupling from Satellite Remote Sensing and Reanalysis, J Hydromet. 12(6):1221-1254, DOI: 10.1175/2011JHM1380.1 Ferguson, C R; Wood, EF; Vinukollu, RK, 2012. A Global Intercomparison of Modeled and Observed Land-Atmosphere Coupling J Hydromet. 13(3):749-784. DOI: 10.1175/JHM-D-11-0119.1, June. Taylor, CM et al. 2012 Afternoon rain more likely over drier soils, Nature, doi:10.1038/nature11377
MERRA AIRS What do “observations” say about land-atmospheric coupling and convection? Fractional composition AIRS (from Ferguson and Wood, 2011) MERRA Afternoon convection over dry soils wet soils Using ASCAT/AMSR-E/CMORPH (from Taylor et al, 2012)
SM-LCL SM-EF EF-LCL Comparisons among models of their (Kendall )correlation between land surface variables (SM: soil moisture; EF: Evaporative fraction) and measures of coupling (e.g. LCL: Lifting Condensation Level). (Ferguson et al., 2012)
Differences in predictions of preferences for convection over wet or dry soils (Taylor et al., Nature 2012)
Is there consistency on projections of global and regional drought from CMIP5? CMIP5 Models 20C Evaluations: Frequency of Short-Term (4-6 month) Drought VIC Off-line LSM
Is there consistency on projections of global and regional drought from CMIP5? CMIP5 Models 20C Evaluations: Frequency of Long-Term (> 12 months) Drought VIC Off-line LSM CMIP5 Models
Correlation between Precipitation and other Land Budget Components (DJF) Runoff Evap Soil Moist Off-line LSM CanESM2 CSIRO-Mk3 GISS-E2-H GISS-E2-R IPSL-CM5A-LR MIROC-ESM-CHEM
Correlation between Precipitation and other Land Budget Components (JJA) Runoff Evap Soil Moist Off-line LSM CanESM2 CSIRO-Mk3 GISS-E2-H GISS-E2-R IPSL-CM5A-LR MIROC-ESM-CHEM
Global budgets Globe Ocean basin budgets Ocean WV Divergence analyses Continent Continental & basin scale water/ energy budgets Basin FluxNet Tower Data Point Year Decade Month Day Can a framework be developed for water and energy cycle model evaluation? Potential data sets and approaches Spatial Scales Temporal Scales
Product validation: Some statistical issues Temporal averaging Global budgets Globe Ocean basin budgets Ocean WV Divergence analyses Inter-annual variability Seasonal variability Long-term climatology Continent Continental & basin scale water/ energy budgets Trend analysis, Detection of climate change? Basin FluxNet Tower Data Point Spatial sampling (MTE) (Representativeness) Year Decade Month Day Spatial Scales Temporal Scales
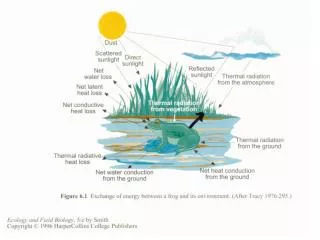
Global budgets Globe Ocean basin budgets Ocean WV Divergence analyses Seasonal variability Inter-annual variability Continent Continental & basin scale water/ energy budgets Spatial sampling (MTE) (Representativeness) Temporal averaging Basin FluxNet Tower Data Point Year Decade Month Day Product validation: Some scaling challenges P= E Long-term climatology Spatial Scales Continental and Basin budgets Rn = E+H+G Temporal Scales
Atmospheric Budget Globe dSa -HQ+ P E = dt Ocean River Basin Water Budget Continent dSl + P - D E = - dt Surface Radiation Budget Basin Rn = E + H + G Land Surface Models Point Year Decade Month Day Can we use basin water budgets to constrain ET? Remote Sensing Land Surface Models Reanalysis models Global budgets Ocean basin budgets WV Divergence analyses Spatial Scales Continental to basin scale water/ energy budgets FluxNet Tower Data Reanalysis ISCCP/SRB FluxNet GRACE in-situ in-situ Remote sensing (RS) RS LSM Temporal Scales
Ocean/Continental Budgets H Q= dSa - Globe -H Q+ P= Einferred dt Ocean dSl + D dt Continent Basin SSM/I GRACE in-situ + LSM QuikSCAT Reanalysis Point Year Decade Month Day Can we use continental water budgets to constrain ET? Remote Sensing Land Surface Models Reanalysis models Global budgets Ocean basin budgets WV Divergence analyses Spatial Scales Continental to basin scale water/ energy budgets FluxNet Tower Data Temporal Scales
Major strategic issues for evaluating climate models • Need to develop consistent, global time series of water budget variables for the evaluation of global models i.e. Climate Data Records (GCOS/NOAA) or Earth System Data Records (NASA). • Some Evaluation issues: • How can we best assess the uncertainty among model predictions/projections of the same variable? • What constraints can be applied to limit the uncertainty in the water budget variables? • Can we develop a merged water budget, with budget closure? (Yes, see Pan et al, J Climate, 25(9): 3191-3206, May, 2012)
To what extent can we improve process representation to improve predictive skill? Hyper-Resolution, Global Land Surface Modeling: Are there pathways for addressing this need and will such models improve predictive capabilities?
High Resolution Precipitation is needed State Space Estimation mm • Combine the spatial variability of NEXRAD radar data with the local accuracy of rain gauges. • Use the state – space linear estimation to correct the radar data with rain gauges (Chirlin G. R. and Wood E. F., 1982). 5
High Resolution Soil Properties are needed loamy sand Ks (mm/day) % Clay TI • No data exists at high resolution • Average properties of different soil types • Variability estimation • Define a linear relationship between Topographic index and % clay • Randomly sample % silt and sand • Use pedotransfer functions, to calculate hydraulic properties per grid cell. 6
High Resolution Topography 1/8⁰ Grids Topographic Index 1 km (30”) 500 m (15”) 90 m (3”) • Current resolutions models do not account for topography • Data is available Globally • Hydrosheds (Lehner et al. 2008) • TOPLATS • Only model to account for topography • Use it to see what variables account for the most variability 7
Impact on including spatial variability in predicting soil moisture (from Assessment of large scale and regional scale models for application to a high resolution global land surface model (Roundy, Chaney and Wood, AGU Fall Meeting, 2011) % Volume Soil Moisture Realization Soil Random + Properties + Noise Uniform + Precipitation + Topography Spatial Variability (Std) Soil Moisture (% Vol.) Julian Day (2006)
Summary Needs and challenges: The community must continue working with the space and data agencies (NASA, ESA, EUMETSAT, JAXA, NOAA, etc) to development of “validation” quality data records. They’ve done a pretty good job. International programs and data centers **must** work harder to provide in-situ sets that are critical to assessment and validation (i.e. for “benchmarking”) or for merging with other data. They’ve done a poor job. Alternative representations and algorithms for hydrologicprocess must get evaluated – more validation (“benchmarking”) and analysis activities are needed by the community – NEWS is making progress in this area but more $$ are needed.