Download
1 / 21
210 likes | 295 Views
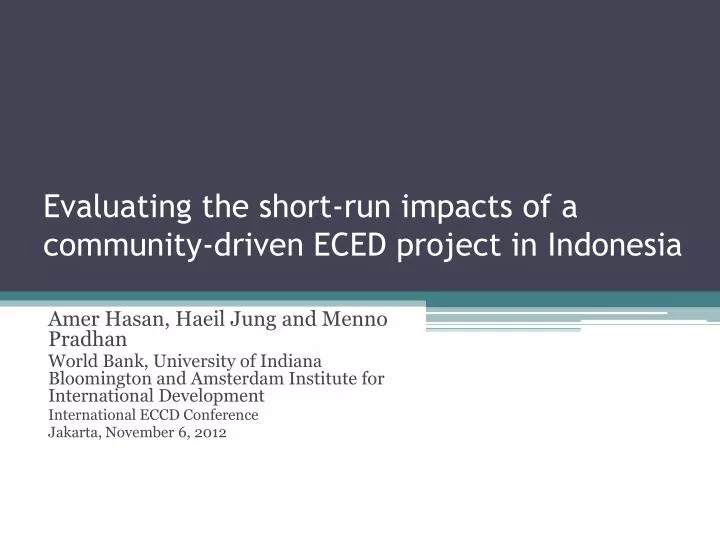
Evaluating the short-run impacts of a community-driven ECED project in Indonesia. Amer Hasan , Haeil Jung and Menno Pradhan World Bank, University of Indiana Bloomington and Amsterdam Institute for International Development International ECCD Conference Jakarta, November 6, 2012. Outline.

E N D
Evaluating the short-run impacts of a community-driven ECED project in Indonesia AmerHasan, Haeil Jung and Menno Pradhan World Bank, University of Indiana Bloomington and Amsterdam Institute for International Development International ECCD Conference Jakarta, November 6, 2012
Outline • A bit of history • The project • The evaluation • The data • The results • The next steps
The ECED Project in Indonesia addresses long-standing challenges • Low enrollment rates among the poor • Low enrolment rates among 0-3 year olds • A lack of government investment • Few options for teacher training
An example: Low enrollment rates among the poor and children 0-3
The Early Childhood Education and Development Project in Indonesia • Seeks to address these challenges • Active in: • 50 poor districts • 3,000 poor villages • Provided • 6,000 ECED centers • 12,000 trained village teachers • 500,000 children to date
The project has multiple components, implemented sequentially 1 2 3
MAP OF WORLD BANK SUPPORTED ECED PROGRAM : Sumatera Selatan 1. Ogan Komering Ilir • Coverage: • 50 districts • 6,000 ECED centers • 12,000 trained village teachers • 500,000 children Nangroe Aceh Darussalam: 1. Aceh Tenggara 2. Aceh Tengah Sumatera Utara : 1. Toba Samosir 2. Tapanuli tengah Sumatera Barat : 1. Solok 2. Sawahlunto/Sijunjung 3. Pesisir Selatan Jambi : 1. Tanjung Jabung Timur 2. Sarolangun I II V III Sulawesi Utara : IV 1. Kepulauan Talaud Bengkulu : 2. Kepulauan Sangihe 1. Bengkulu Utara Jawa Tengah : 2. Bengkulu Selatan 1. Rembang Maluku Utara : Jawa Timur : Sulawesi Barat : 2. Wonogiri Halmahera Utara 1. Pacitan 1. Polewali Mandar Lampung : 3. Cilacap Halmahera Selatan 2. Madiun 2. Mamuju 1. Lampung Timur 4. Banjarnegara 3. Bondowoso 2. Lampung Selatan Irjabar : Sulawesi Selatan : DI Yogyakarta : Manokwari NTB: 1. Sinjai Jawa Barat : 1. Kulonprogo 1. Lombok Tengah 2. Sidrap 1. Sumedang 2. Gunung Kidul Papua 2. Sumbawa 3. Wajo 2. Sukabumi Merauke 3. Dompu 4. Jeneponto 3. Subang Kalimantan Barat : Jayapura 4. Majalengka 1. Sambas NTT: Gorontalo : 5. Garut 2. Ketapang 1. Sumba Barat 1. Gorontalo 2. Timor Tengah Utara 2. Boalemo
Overall the focus of the project is on the country’s worse off districts
Project centers are important providers of access to ECED services
The impact evaluation design relied on the fact that the project was rolled out in phases Villages receive treatment at baseline Villages receive treatment at midline Villages in same districts that never receive the treatment
The project has multiple components, implemented sequentially 1 2 3
2010 Difference due to longer exposure to the project 2009 2008 Effect of project compared to no project Villages are assigned to treatment or control status using randomization. Comparison villages are suggested by villages leaders. Enrollment increases with age but more so in villages with the project. Average enrollment rate of five-year-olds (SUSENAS, 2010) Average enrollment rate of 4-year-olds (SUSENAS, 2010) Effect of facilitation + new centers Effect of facilitation
Enrollment effects increase as children get older and then get smaller
Average effects on development outcomes in the short-run are small
But mask the fact that project had bigger effects on worse-off groups
Digging Deeper • The effects shown so far look at impact of availability of services • What about attendance of services?
Project centers target poorer children Villages with project Villages without project
Summary of Findings • Enrollment increases as a result of the project • In the short-run, average effects are small and hide important differences across sub-groups • Project has larger short-run effects on child development outcomes for • Children from poor families • Children who had never been to ECED services before the project • Some successes, some challenges • Project centers target poor children
Thank you • Questions?