Download
1 / 21
210 likes | 431 Views
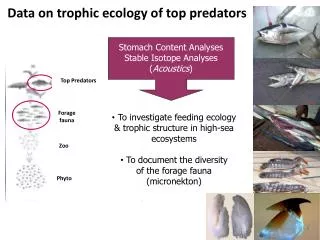
Invertebrate Predators. L. Madin, E. Horgan, B. Sullivan, S. Bollens GLOBEC Georges Bank Science Meeting Nov. 19, 2003. Predation Mortality Calculation. Plot abundance maps per predator, depth, month, year. 5 standard regions, 3 depth ranges Add distribution of prey

E N D
Invertebrate Predators L. Madin, E. Horgan, B. Sullivan, S. Bollens GLOBEC Georges Bank Science Meeting Nov. 19, 2003
Predation Mortality Calculation • Plot abundance maps per predator, depth, month, year. • 5 standard regions, 3 depth ranges • Add distribution of prey • Predator abundance x feeding rate = Predation Capacity for each station • Adjust Predation Capacity for temperature effect & prey selection to models • Divide Predation Capacity by target prey abundance for Instantaneous Mortality • Sum Instantaneous Mortality values for all co-occurring predators = total predation impact per prey species