Download

1 / 29
300 likes | 488 Views
Benefits, costs and income statement. Expenses x costs. Costs – financila accounting: Amount of money which the enterprise used to get benefits. General economic view: The amount of money used to get higher utility, it includes oportunity costs. Costs ≠ Expenses

E N D
Expenses x costs Costs – financila accounting: Amount of money which the enterprise used to get benefits. General economic view: The amount of money used to get higher utility, it includes oportunity costs. Costs ≠ Expenses Expenses – any decreases of the amount of money (cash or bank accounts).
Benefits x revenues Benefits ≠ Revenues Benefits – amount of money, which the enterprise got for a given period aside from the payment of the money. Money equivalent of sold achievement of the enterprise. revenues – any increase of the amount of money (cash or bank accounts).
Economic result Economic result = Benefits – costs If: Benefits > Costs → Profit Benefits < Costs → Loss
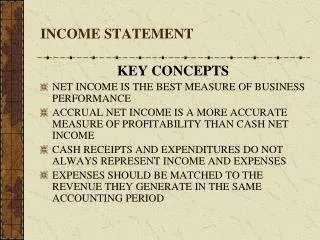
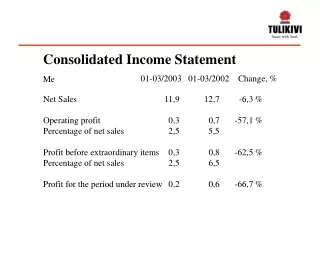
Income statement (profit and loss account) Shows business revenues compared with expenses over a given time period REVENUES – amounts received from customers for goods or services delivered to them EXPENSES – costs that have arisen in generating revenues NET INCOME – revenues minus expenses (loss or profit)
Incomestatement http://www.youtube.com/watch?v=Bpcn7QYOTx0
What do you remember about costs? Short- term period: • Fixed costs – are not directly relatedto the level of production (include depreciation, rate, interest from loan). They change in one shot. • - total fixed costs are the sum of the fixed costs. • Variable costs – change in direct relation to volume of output. • - they may include cost of sold goods or production expenses such as labor and power costs • total variable costs (TVC) are the sum of the variable costs for the specified level of production or output. • average variable costs (AVC) are the variable costs per unit of output or of TVC divided by units of output • In the long term period are all costs variable.
Categories of variable costs According to the level of output: a) same period→ proportional costs, b) faster→ progressivecosts, c) slowly → digressive costs.
Break-Even Analysis • A break-even point defines when an investment will generate a positive return. • Break-even analysis is a useful tool to study the relationship between fixed costs, variable costs and returns. • Break-even analysis computes the volume of production at a given price necessary to cover all costs . • Break-even price analysis computes the price necessary at a given level of production to cover all costs
http://www.youtube.com/watch?v=RAALn2rwQyU http://www.youtube.com/watch?v=sG4YiJZSuI8 Homework: http://www.youtube.com/watch?v=69mVcnewPbw&feature=related
Analysis of Break-Even point Describes the relationship between profit, costs, volume of production, price of production and benefits. For the same type of production is the total revenue: TR = P * Q TR – Total revenues, P – price per unit, Q – quantity of production (= sale). Cost function:TC = FC + AVC * Q TC – total costs (proportional costs), FC – fixed costs, AVC – average variable costs (variable cost/unit).
Break-even point Break-even point (critical point of rentability) – volume (quantity) of production Q, when total revenues equals total revenues (TR = TC).
Break- even point in non-linear model bod maximálního zisku
Break-Even Point Problem: The company had this structure of costs: Material for consumption 1 000 000 CZK Wages of workers 200 000 CZK Wages of administrative staff 50 000 CZK Rent 400 000 CZK Energy for machines 100 000 CZK Heating and illumination 50 000 CZK Advertisement 60 000 CZK Transport of material 80 000 CZK Depreciation of investment assets 140 000 CZK There were produced 1 500 products. Fill in the table and find out the total fixed and variable cost and avarage VC. Find out the cost function.
Problem II: Theenteprise had productionresults in 2010 and 2011: Find out the cost function and the total costs, if in the year 2003 the quantity of production was 50 000.
Break Even point 1) From the cost function given before find out the break even point in units, if the price/unit is 5 CZK. 2) Find out the break-even point in CZK.
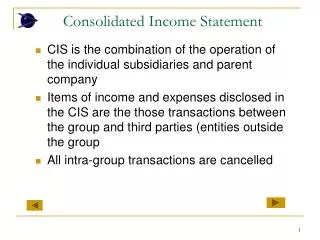
Statementof Cash Flow In financial accounting, a cash flow statement, also known as statement of cash flows or funds flow statement,is a financial statement that shows how changes in balance sheet accounts and income affect cash and cash equivalents, and breaks the analysis down to operating, investing, and financing activities. Essentially, the cash flow statement is concerned with the flow of cash in and out of the business. http://www.youtube.com/watch?v=JGcbsj6FN6c
Statement of Cash Flows (2002) OPERATING ACTIVITIES Net income Add (Sources of cash): Depreciation Increase in A/P Increase in accruals Subtract (Uses of cash): Increase in A/R Increase in inventories Net cash provided by ops. (160,176) 116,960 378,560 353,600 (280,960) (572,160) (164,176)
Statement of Cash Flows (2002) L-T INVESTING ACTIVITIES Investment in fixed assets FINANCING ACTIVITIES Increase in notes payable Increase in long-term debt Payment of cash dividend Net cash from financing NET CHANGE IN CASH Plus: Cash at beginning of year Cash at end of year (711,950) 436,808 400,000 (11,000) 825,808 (50,318) 57,600 7,282
Enterprise´s objectives • Some conceptions: • Maximalization of profit – total profit or some coefficient of the rentability (ROI, ROE, ROA). • Maximalization of market price of shares, • Maximalization of value of the enterprise (MVA, EVA).
Value of corporation Present value of expected future net cash flow (profits) discounted to the present by the suitable discount rate. CFi – expected future cash flow t i – discount rate
Market Value Added Market Value Added – MVA Market Value Added (MVA) is the difference between the equity market valuation of a listed/quoted company and the sum of the adjusted book value of debt and equity invested in the company. The higher the Market Value Added (MVA), the better. The objectives of managers is a maximalization of MVA. Disadvantage: It is possible to count it only for enterprises with marketable shares.
Economic Value Added Economic Value Added – EVA Difference between net profit of the enteprise and its costs of capital. EBIT – Earnings Before Interest and Tax, T – profit tax rate (decimal number), C – long-term invested capital, NOPAT – net operating profit after tax=profit after tax, WACC – náklady na kapitál (decimal number).
EBIT • An advantage of EBIT is it is easier to calculate and easier to observe at divisional or sub divisional levels of the firm. • Instead of EBIT also the term Operating profit is widely used.
WACC • The cost of capital generally measured as weighted average cost of capital (WACC). • WACC is the cost of debt, such as interest on a loan, and the cost of equity investment, or rate of return.
EVA • is a financial performance method to calculate the true economic profit of a corporation. • EVA can be calculated as net operating after taxes profit minus a charge for the opportunity cost of the capital invested. • Economic Value Added is a flow and can be used for performance evaluation over time
Economic Value Added • EVA can be plus or minus number. The aim of business is to have plus results of economic value added, in this case the value of the firm increases. • The enterprise should stop all the activities, which profit margin ration is lower than WACC. • EVA shows that also own capital has to bring sufficient rate of return.