Download
1 / 18
180 likes | 316 Views
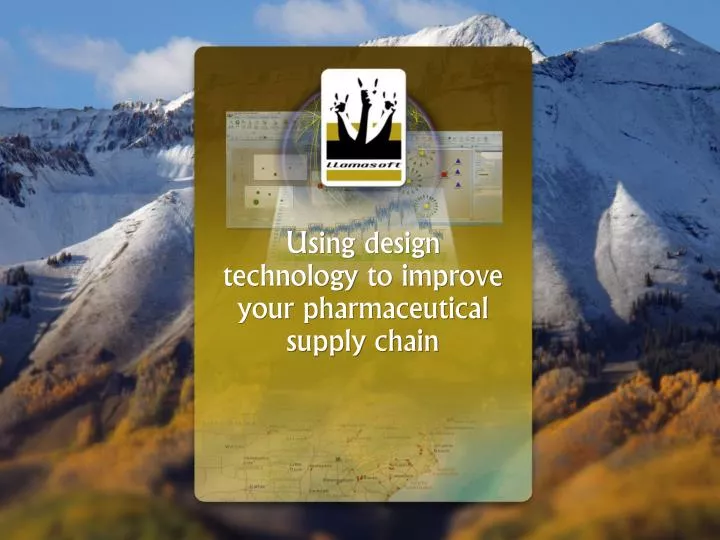
Using design technology to improve your p harmaceutical supply chain. Do you ever ask yourself…. Do I have the right number of regional warehouses? Are they in the right place? Where should I be stocking products to reduce and prevent stock-outs and product wastages?

E N D
Using design technology to improve your pharmaceutical supply chain
Do you ever ask yourself… • Do I have the right number of regional warehouses? • Are they in the right place? • Where should I be stocking products to reduce and prevent stock-outs and product wastages? • How many trucks do I need and what routes shouold they follow? • How should parallel health programs be combined to increase efficiency? • How can cost be reduced without compromising patients’ access to medicines? • What should I do today to prepare for the changing health needs of my countries growing population?
Supply Chain Design Tools and Techniques • Network Optimization • Most cost effective network (number and location of warehouses) • Subject to practical rules or “constraints” • Inventory Optimization • Demand profiling (understanding the needs of various customers) • Safety stock determination (how much of each product to stock) • Multi-echelon optimization (Where to place the inventory) • Supply Chain Simulation • Evaluation of how network will perform in real world • Service Rates and Real-time Inventory levels • Comparative Benchmarking • GIS Mapping and Service Evaluation
USAID | DELIVER: Haiti Unified Supply Chain Currently 7 distinct delivery networks in country, what’s the best way to combine them?
USAID | DELIVER: Haiti Unified Supply Chain • Recommendation to serve the country via 3 regional warehouses (as opposed to 13 depots) • Accounts for weather-related road conditions • Includes contingency plan for primary port closure • Considers plans for development and population migration • Fewer sites correspond to increased ease of oversight and reduced costs from operation overhead and security
TB High HIV USAID | DELIVER: Haiti Unified Supply Chain Cholera/Diarrhea Malaria Pharma Product Segmentation Vaccines Criticality of Product Blood Safety Continuous Replenishment Disaster Relief Other Essentials Bednets Fully Flexible WASH Family Planning Low Low High Demand Variability Lean / Cont. Replenishment Agile Result: • Combine all Lean and Agile product groups • Cont. Replenishment (HIV/TB) to be kept separate for initial phase • Disaster relief not to be included in unified SC Lean
Cote d’Ivoire District Hub Assessment We have an existing set of district pharmacies and only one central warehouse. How many of those should be stock-holding positions? Potential Stocking Locations Demand aggregated by district
Cote d’Ivoire District Hub Assessment • Distance Optimized Scenario results 1 HUB 2 HUB Current • Gagnoa • Abengourou • Yamoussoukro • Korhogo • Daloa 5 HUB 3 HUB 4 HUB
Transportation Optimization: Tanzania Chamwino District Pilot Given seasonal road conditions, what are the best routes to follow and how many trucks will I need to serve the demand year-round? Zone + 1 node: Wet Season Zone + 1 node: Dry Season Equipment: 3.5t Distance: 574km Qty: 40 Equipment: 3.5t Distance: 997km Qty: 58
Lesotho distribution strategy Current network is a hybrid of centralized and decentralized flows. What is the best option and how can I improve service levels? Decentralized Baseline (Current System) Direct
Lesotho distribution strategy • Result: 5% decrease in transportation costs by shipping everything direct • Shipping direct also increases the oversight at the central level and allows for centralized safety stock
Lesotho Safety Stock Analysis • Assessed the safety stock amounts and associated costs at 80%, 95% and 99% service levels To move from 80% to 95% doubles inventory. To move from 95% to 99% incurs another 41% cost increase.
Lesotho Safety Stock Analysis (cont.) • Much of the cost is driven by varying lead times (variability) of pharmaceutical deliveries. What if we can reduce variability?
Supply Chain 2020: Preparing for the future • Goal • Predict supply chain requirements for public health networks for 2020-2024 • Approach • Develop a general and quantitative modeling approach consisting of three models • Health Model • Material Requirements Model • Supply Chain Metrics Model • Develop re-usable tools and a robust modeling framework • Outcomes • Visualize & understand likely situations 10 years from now • More proactive long term supply chain planning activities • Re-usable framework that can be applied to any country
Supply Chain 2020: Tanzania • Prior to understand the true health needs of 2020 -2025, the effects of the proposed plan to move to direct delivery were evaluated • Implementing Direct Delivery will require a significant budget increase • Optimizing the customer-warehouse assignment will result in cost savings
Supply Chain 2020: Tanzania • Population profile from 2020-2025 • Expected disease prevalence and treatment rates for 2020 onwards • All regions under direct delivery • Warehouse capacities increased based on current expansion plans
Supply Chain 2020: Tanzania An example result of Health Model Scenario: Increased Contraceptive Prevalence Rate • Used results from a Futures Group study to increase contraceptive prevalence rate growing at an ‘optimistic yet realistic’ rate • In addition, it was assumed that Family Planning was of increased priority - on par with HIV, TB, and malaria • Results: • Several customers did not receive their share of the Other Essential Medicines Bundle and ORS due to rationing of warehouse resources. • In addition to this, transportation costs increased by 0.7% and overall costs increased by 0.5%
We completed the analysis. What now? • Key factors for success: • Engagement from all key stakeholders • Buy-in of decision makers • Educating and enabling those responsible for changes • Further analysis (with high quality data) to hone in on specific issues • Continued analysis, as the landscape continues to change