Download
1 / 10
100 likes | 113 Views
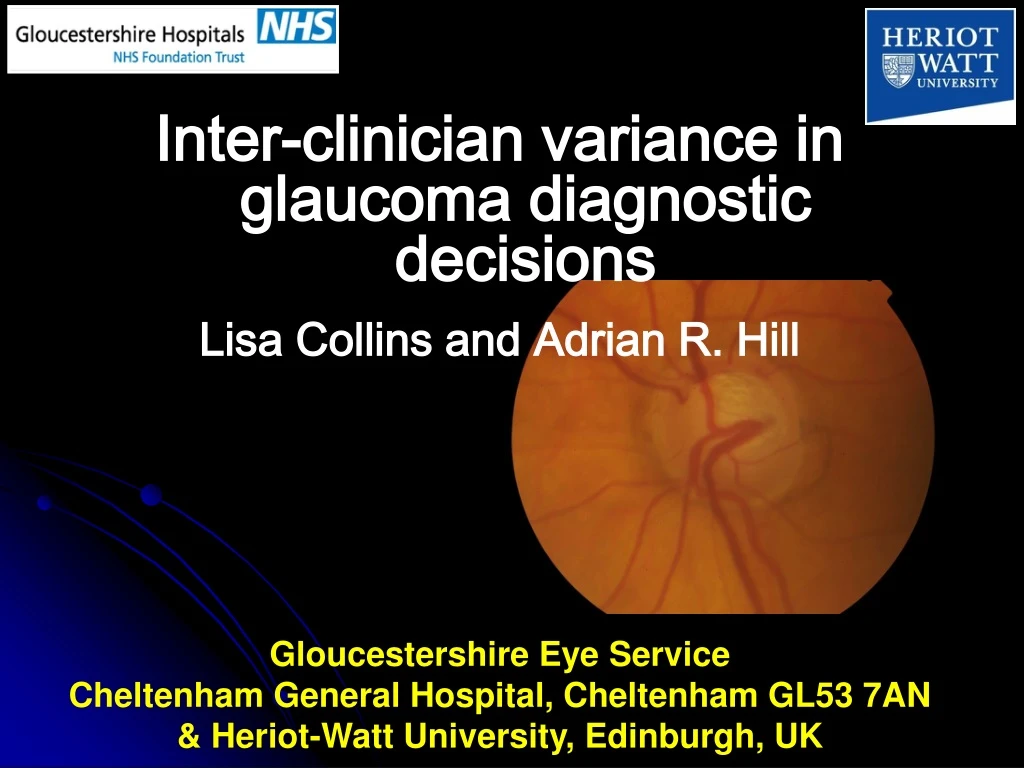
Inter-clinician variance in glaucoma diagnostic decisions Lisa Collins and Adrian R. Hill Gloucestershire Eye Service Cheltenham General Hospital, Cheltenham GL53 7AN & Heriot-Watt University, Edinburgh, UK. Acknowledgements

E N D
Inter-clinician variance in glaucoma diagnostic decisions Lisa Collins and Adrian R. Hill Gloucestershire Eye Service Cheltenham General Hospital, Cheltenham GL53 7AN & Heriot-Watt University, Edinburgh, UK
Acknowledgements Thanks are due to: Prof. Andrew McNaught, Mr James Nairne, Prof. Richard Wormald, Prof. Rupert Bourne, Mr Ted Garway-Heath, Dr Paul Spry, Prof. Peter Aspinall, Prof. Baljean Dhillon and Mrs Frances Reilly Corresponding author’s e-mail: lisa.collins@glos.nhs.uk 1. INTRODUCTION The diagnosis of open-angle glaucoma is multi-factorial and there are many instances where clinical uncertainty exists; particularly in the early stages of the disease. In order to explore the clinical criteria used by ophthalmologists in making diagnostic decisions for glaucoma, we observed real-life patterns of clinical behaviour, rather than self-reported criteria, across a range of cases. 2. AIMS To examine the nature of individual similarities and differences in the clinical criteria used by a group of expert ophthalmologists when diagnosing glaucoma.
3. METHOD • The sample comprised 36 participants, age range 51-91 yrs (mean 70.2 yrs), 13 males (mean 70.9 yrs) and 23 females (mean 69.9 yrs). The IOP range was 11-33 mmHg and the anterior angle grade II-III (Van Herick). • 32 participants had been newly referred from primary-care optometrists for suspected glaucoma, 4 participants were recruited as known “normal”. • 5 consultant glaucoma specialists from different UK hospitals, examined each of the 36 participants in a four hour session. • Real-life clinical information was presented for each participant. • All participants underwent pupil dilation and were examined by each doctor (ophthalmologist) in an order defined by a Latin Square experimental design. • Doctors did not confer with each other or with the participants. • Doctors recorded the presence of observed features of the optic nerve head, the visual field status, and their diagnostic and treatment decisions.
4. RESULTS Only right eye data are presented; similar findings were obtained for the left eye. Table 1: An example cross-tabulation of diagnostic decisions All pairs of doctors gave Kappa statistics of agreement for the 3 diagnostic categories of K = 0.374 to 0.684 (all sig. at p ≤ 0.01). Only 2 pairs of doctors showed reasonable agreement at K > 0.60 and there were instances where eyes were classified as “normal” by one doctor and “glaucoma” by another.
Table 2 (next slide) This table shows the significant variables at p ≤ 0.01 (df = 2) for each doctor which provided effective discrimination for the diagnostic categories of “glaucoma”, “suspected glaucoma” and “normal”. Different sub-sets of variables or indicators (present v absent) were used by each of the doctors, and not all used IOP or visual field status (“normal” v “abnormal”) as significant indicators for their diagnosis. Three variables (i.e. discriminators) were common to all doctors’ decisions; these were: C:D ratio estimate, Failure of the ISNT rule(present v absent), Generalised assessment of the optic nerve head (“normal” v “abnormal”). Additionally, the following variables were significant to at least four doctors: notching of the neuro-retinal rim, flame haemorrhage, and visual fields’ status.
Table 3: Summary Kruskal-Wallis one-way ANOVAs by doctor Table 2: Summary Kruskal-Wallis one-way ANOVAs by doctor Chi square significant variables shown in red at p ≤ 0.01 (df = 2) (p values rounded down)
Non-parametric clustering analyses (Latent Class analysis) were performed for each doctor to determine the Bayesian probabilities associated with the principal discriminating variables associated with diagnostic decisions. Data for Doctor 2 gave a highly discriminating 3-cluster model consistent with the three diagnostic decision categories of “normal”, “suspect” and “glaucoma” (Fig. 1). Clinical decisions for four of the doctors gave different 2-cluster models which distinguished decisions for “normal” (cluster 1) from a combined cluster of “glaucoma and suspect glaucoma” (cluster 2). See example in Fig. 2. Fig. 1 and Fig. 2 on the next two sides Bayesian probability (P) profiles comparing a 3-cluster model for Doctor 2 and a 2-cluster model for Doctor 5 For ease of comparison, both sets of probability profiles in Figures 1 and 2 are presented for the same eight variables, although four other variables were significant for Doctor 2 and two other variables significant for Doctor 5 (see Table 2).
Fig. 1: Graph ordinates are Bayesian conditional probabilities: P = p (IOP high | cluster group membership) P = p (CD ratio high | cluster group membership) P = p (other variable features absent | cluster group membership) The wider the separation of the profiles, the greater the discrimination. P Doctor 2 “Normal” P=0.89 “Suspect” P=0.91 “Glaucoma” P=0.97
Fig. 2: Graph ordinates are Bayesian conditional probabilities: P = p (IOP high | cluster group membership) P = p (CD ratio high | cluster group membership) P = p (other variable features absent | cluster group membership) The wider the separation of the profiles, the greater the discrimination. P Doctor 5 “Normal” P=0.74 “Glaucoma” P=0.54 and “Suspect” P=0.44
5. CONCLUSIONS • This study has demonstrated that glaucoma specialist consultant ophthalmologists use different sub-sets of clinical variables for diagnosing glaucoma. • Only three significant optic disc diagnostic discriminators were • common to all five ophthalmologists. • The greater the number of variables used as significant • discriminators for diagnosis, the more complex are the doctor’s • judgements. • Inter-correlations in Latent Class Analysis showed that either a • two or three cluster model optimally described the diagnostic • decisions for each doctor. • These findings highlight a need for identifying common diagnostic criteria to improve the: • detection and referral of patients with suspected • glaucoma by primary care clinicians, • consistency of patient management between • ophthalmologists and allied clinicians, • clinical training and decision-making for junior • ophthalmologists and allied clinicians.