Download
1 / 18
200 likes | 544 Views
SPE 95545 Log-Based Pore Volume Compressibility Prediction- A Deepwater GoM Case Study. Chris Wolfe (Baker Atlas) Contributing Authors: Charles Russell (ENI Petroleum) Nicola Luise (ENI Petroleum) Richin Chhajlani (Chevron). Outline. Study objectives

E N D
SPE 95545 Log-Based Pore Volume Compressibility Prediction- A Deepwater GoM Case Study Chris Wolfe (Baker Atlas) Contributing Authors: Charles Russell (ENI Petroleum) Nicola Luise (ENI Petroleum) Richin Chhajlani (Chevron)
Outline • Study objectives • Geological setting/operational procedure • Basics of reservoir compressibility & compaction • Log-based Methodology • Results • Discussion
Value of Obtaining PVC Early in the Project • Allows for quick calculation of expected compaction • Reservoir drive determination • Reserves estimates • Reservoir pressure maintenance • Production forecasting • Casing collapse issues • Aid in calculating the overall value of the project
This was done 8 months after the log-based PVC was computed. Study Objectives • Compute the log-based pore volume compressibility (PVC) immediately after logging of the well • Compute the expected compaction using the log-based PVC results • Compare the PVC results obtained from the log-based method to the lab results
Geologic Setting/Operational Procedure Salt Sand “X” original hole sidetrack Sand “Y” top Sand “Y” bottom ~50’
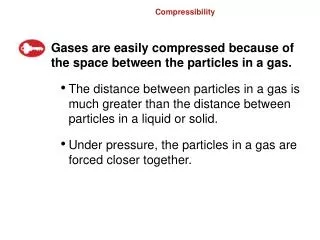
Modes of Compaction focus of this study elastic or reversible • “Elastic region”: • Low effective stress levels • Gradual porosity decrease • Relatively low compressibility • Small displacements • reversible Porosity post-pore collapse pore collapse stress pore collapse Effective Stress Increase (pore pressure decrease)
Elastic Compressibilities- Definitions Compressibility is defined as change in volume for a given change in pressure. • Bulk compressibility, Cbx • Pore volume compressibility, Cpx • Grain compressibility, Cgx Subscripts: The first subscript (b=bulk, p=pore, g=grain) denotes the compressibility under changing x, where x is either p (changing pore pressure) or c (changing confining pressure) These are traditionally obtained from lab testing!
Typical Lab Testing Uniaxial Strain Test Hydrostatic Test Triaxial Test s1 s1 s1 d1 d1 d1 s1 l s3 s3 l l d3= 0 d d d3/2 d d3/2
Log-based Rock Mechanical Properties- Logging of Mechanical Properties (LMP) sa sc Log Inputs Dtc, Dts, rb, volume fractions Produce stress- strain curves Produces a “virtual core sample” sa Apply “virtual” stresses to the “virtual core sample” ea er Static Mechanical Properties: rock strength, elastic moduli Poisson’s ratio, compressibilities
Logging of Mechanical Properties (LMP) vs Lab Testing Sand “X”
Log-Derived Compressibility – Methodology • Calculate bulk compressibility (Cbc) from LMP→ • Calculate pore volume compressibility (PVC) → • Convert pore volume compressibility [Cpp] into uniaxial strain ‘equivalent’ pore volume compressibility [Cpp(u)] • Repeat the process at each stage of drawdown (assume a value for Ko) NOTE: Cgc (quartz) ≈ 1.6 x 10⁻⁷ psi-1 NOTE: f is the effective porosity, n is static Poisson’s ratio, E is static Young’s modulus and Ko = Dsmin/Ds max
PVC Comparison – LMP vs. Lab Sand “X” Ko (log-based) → assumed to be 0.5 Ko (lab) → calculated to be 0.18
PVC Comparison – LMP vs. Lab Sand “Y”- top Ko (log-based) → assumed to be 0.5 Ko (lab) → calculated to be 0.18
PVC Comparison – LMP vs. Lab Sand “Y”- bottom Ko (log-based) → assumed to be 0.5 Ko (lab) → calculated to be 0.18
PVC Comparison – LMP vs. Lab Sand “X” Ko (log-based) = Ko (lab) = 0.18
Discussion • The log-based calculations were completed two weeks after the well was logged (8 months prior to lab testing) • Log-based RMP & PVC results matched favorably with the lab-determined results • Due to the low PVC values, the expected compaction is low • compaction drive cannot be relied upon • potential permeability reduction due to compaction should be minimal • The log-based approach allows for quick & reliable assessment of the PVC • project sanctioning decisions can be made upfront • Due to the low PVC, Ko ramifications are minimal. For weakly consolidated formations, this may not be the case.