Download
1 / 55
550 likes | 556 Views
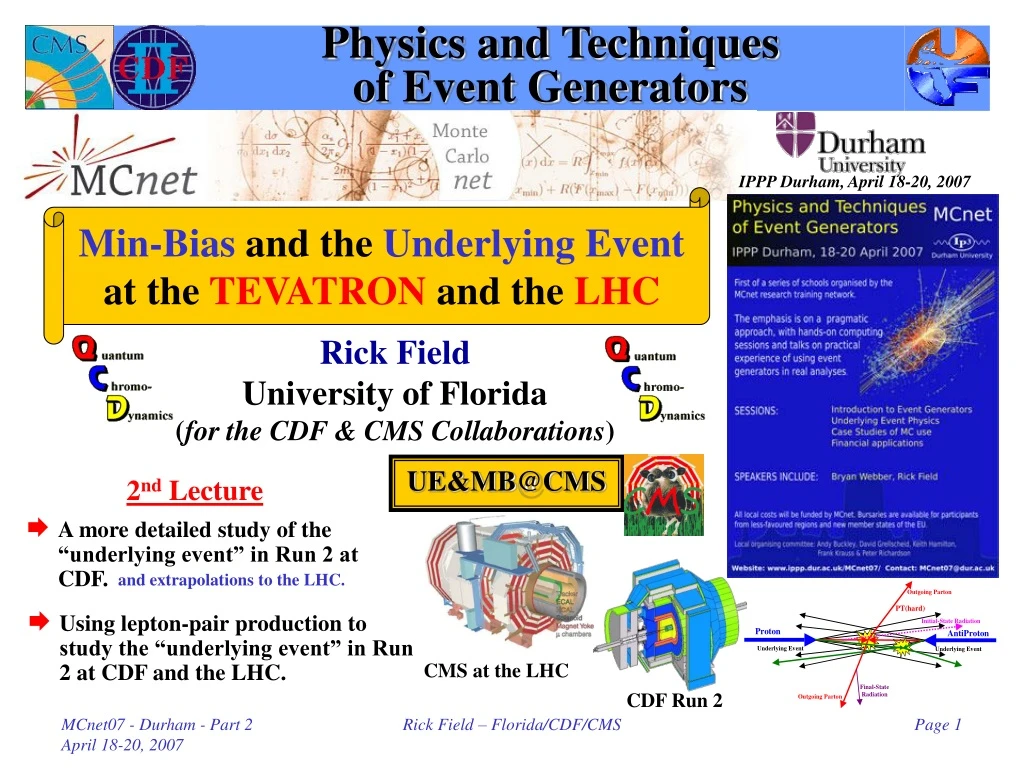
Physics and Techniques of Event Generators. IPPP Durham, April 18-20, 2007. Min-Bias and the Underlying Event at the TEVATRON and the LHC. Rick Field University of Florida ( for the CDF & CMS Collaborations ). UE&MB@CMS. 2 nd Lecture.

E N D
Physics and Techniques of Event Generators IPPP Durham, April 18-20, 2007 Min-Bias and the Underlying Event at the TEVATRON and the LHC Rick Field University of Florida (for the CDF & CMS Collaborations) UE&MB@CMS 2nd Lecture • A more detailed study of the “underlying event” in Run 2 at CDF. and extrapolations to the LHC. • Using lepton-pair production to study the “underlying event” in Run 2 at CDF and the LHC. CMS at the LHC CDF Run 2 Rick Field – Florida/CDF/CMS
The “Transverse” Regionsas defined by the Leading Jet • Look at charged particle correlations in the azimuthal angle Df relative to the leading calorimeter jet (JetClu R = 0.7, |h| < 2). • Define |Df| < 60o as “Toward”, 60o < -Df < 120o and 60o < Df < 120o as “Transverse 1” and “Transverse 2”, and |Df| > 120o as “Away”. Each of the two “transverse” regions have area DhDf = 2x60o = 4p/6. The overall “transverse” region is the sum of the two transverse regions (DhDf = 2x120o = 4p/3). Charged Particle Df Correlations pT > 0.5 GeV/c |h| < 1 Look at the charged particle density in the “transverse” region! “Transverse” region is very sensitive to the “underlying event”! Rick Field – Florida/CDF/CMS
Leading Jet Charged Particle Density Df Dependence • Shows the Df dependence of the charged particle density, dNchg/dhdf, for charged particles in the range pT > 0.5 GeV/c and |h| < 1 relative to jet#1 (rotated to 270o) for “leading jet” events 30 < ET(jet#1) < 70 GeV. Log Scale! Min-Bias 0.25 per unit h-f • Also shows charged particle density, dNchg/dhdf, for charged particles in the range pT > 0.5 GeV/c and |h| < 1 for “min-bias” collisions. Rick Field – Florida/CDF/CMS
Charged Particle Density Df Dependence • Look at the “transverse” region as defined by the leading jet (JetClu R = 0.7, |h| < 2) or by the leading two jets (JetClu R = 0.7, |h| < 2). “Back-to-Back” events are selected to have at least two jets with Jet#1 and Jet#2 nearly “back-to-back” (Df12 > 150o) with almost equal transverse energies (ET(jet#2)/ET(jet#1) > 0.8) and with ET(jet#3) < 15 GeV. Refer to this as a “Leading Jet” event Subset Refer to this as a “Back-to-Back” event • Shows the Df dependence of the charged particle density, dNchg/dhdf, for charged particles in the range pT > 0.5 GeV/c and |h| < 1 relative to jet#1 (rotated to 270o) for 30 < ET(jet#1) < 70 GeV for “Leading Jet” and “Back-to-Back” events. Rick Field – Florida/CDF/CMS
0.5 1.0 1.5 2.0 Charged Particle Density Df Dependence “Leading Jet” “Back-to-Back” Polar Plot • Shows the Df dependence of the charged particle density, dNchg/dhdf, for charged particles in the range pT > 0.5 GeV/c and |h| < 1 relative to jet#1 (rotated to 270o) for 30 < ET(jet#1) < 70 GeV for “Leading Jet” and “Back-to-Back” events. Rick Field – Florida/CDF/CMS
Hard Radiation! “Transverse” PTsum Density versus ET(jet#1) “Leading Jet” “Back-to-Back” Min-Bias 0.24 GeV/c per unit h-f • Shows the average charged PTsum density, dPTsum/dhdf, in the “transverse” region (pT > 0.5 GeV/c, |h| < 1) versus ET(jet#1) for “Leading Jet” and “Back-to-Back” events. • Compares the (uncorrected) data with PYTHIA Tune A and HERWIG after CDFSIM. Rick Field – Florida/CDF/CMS
“Transverse” PTsum Density versus ET(jet#1) 30-70 GeV 95-130 GeV Very little dependence on ET(jet#1) in the “transverse” region for “back-to-back” events! Rick Field – Florida/CDF/CMS
“TransMIN” PTsum Density versus ET(jet#1) “Leading Jet” “Back-to-Back” “transMIN” is very sensitive to the “beam-beam remnant” component of the “underlying event”! • Use the leading jet to define the MAX and MIN “transverse” regions on an event-by-event basis with MAX (MIN) having the largest (smallest) charged particle density. • Shows the “transMIN” charge particle density, dNchg/dhdf, for pT > 0.5 GeV/c, |h| < 1 versus ET(jet#1) for “Leading Jet” and “Back-to-Back” events. Rick Field – Florida/CDF/CMS
“Transverse” PTsum Density PYTHIA Tune A vs HERWIG “Leading Jet” “Back-to-Back” Now look in detail at “back-to-back” events in the region 30 < ET(jet#1) < 70 GeV! • Shows the average charged PTsum density, dPTsum/dhdf, in the “transverse” region (pT > 0.5 GeV/c, |h| < 1) versus ET(jet#1) for “Leading Jet” and “Back-to-Back” events. • Compares the (uncorrected) data with PYTHIA Tune A and HERWIG after CDFSIM. Rick Field – Florida/CDF/CMS
Charged PTsum DensityPYTHIA Tune A vs HERWIG HERWIG (without multiple parton interactions) does not produces enough PTsum in the “transverse” region for 30 < ET(jet#1) < 70 GeV! Rick Field – Florida/CDF/CMS
dPT/dhdf + 0.2 GeV/c Charged PTsum DensityPYTHIA Tune A vs HERWIG 308 MeV in R = 0.7 cone! • Add 0.2 GeV/c per unit h-f to HERWIG scalar PTsum density, dPTsum/dhdf. • This corresponds to 0.2 × 4p = 2.5 GeV/c in the entire range pT > 0.5 GeV/c, |h| < 1. Rick Field – Florida/CDF/CMS
Highest pT particle in the “transverse” region! “Transverse” PTmax versus ET(jet#1) “Leading Jet” “Back-to-Back” Min-Bias • Use the leading jet to define the “transverse” region and look at the maximum pT charged particle in the “transverse” region, PTmaxT. • Shows the average PTmaxT, in the “transverse” region (pT > 0.5 GeV/c, |h| < 1) versus ET(jet#1) for “Leading Jet” and “Back-to-Back” events compared with the average maximum pT particle, PTmax, in “min-bias” collisions (pT > 0.5 GeV/c, |h| < 1). Rick Field – Florida/CDF/CMS
Back-to-Back “Associated”Charged Particle Densities Maximum pT particle in the “transverse” region! “Associated” densities do not include PTmaxT! • Use the leading jet in “back-to-back” events to define the “transverse” region and look at the maximum pT charged particle in the “transverse” region, PTmaxT. • Look at the Df dependence of the “associated” charged particle and PTsum densities, dNchg/dhdf and dPTsum/dhdf for charged particles (pT > 0.5 GeV/c, |h| < 1, not including PTmaxT) relative to PTmaxT. • Rotate so that PTmaxT is at the center of the plot (i.e. 180o). Rick Field – Florida/CDF/CMS
Back-to-Back “Associated”Charged Particle Densities “Associated” densities do not include PTmaxT! Jet#2 Region ?? Log Scale! • Look at the Df dependence of the “associated” charged particle density, dNchg/dhdf for charged particles (pT > 0.5 GeV/c, |h| < 1, not including PTmaxT) relative to PTmaxT (rotated to 180o) for PTmaxT > 0.5 GeV/c, PTmaxT > 1.0 GeV/c and PTmaxT > 2.0 GeV/c, for “back-to-back” events with 30 < ET(jet#1) < 70 GeV. • Shows “jet structure” in the “transverse” region (i.e.the “birth” of the 3rd & 4th jet). Rick Field – Florida/CDF/CMS
0.5 1.0 1.5 2.0 Back-to-Back “Associated”Charged Particle Densities “Back-to-Back” charge density “Back-to-Back” “associated” density Polar Plot • Shows the Df dependence of the “associated” charged particle density, dNchg/dhdf, pT > 0.5 GeV/c, |h| < 1 (not including PTmaxT) relative to PTmaxT (rotated to 180o) and the charged particle density, dNchg/dhdf, pT > 0.5 GeV/c, |h| < 1 relative to jet#1 (rotated to 270o) for “back-to-back events” with 30 < ET(jet#1) < 70 GeV. Rick Field – Florida/CDF/CMS
0.5 1.0 1.5 2.0 Back-to-Back “Associated”Charged Particle Densities “Back-to-Back” charge density “Back-to-Back” “associated” density Polar Plot • Shows the Df dependence of the “associated” charged particle density, dNchg/dhdf, pT > 0.5 GeV/c, |h| < 1, PTmaxT > 2.0 GeV/c (not including PTmaxT) relative to PTmaxT (rotated to 180o) and the charged particle density, dNchg/dhdf, pT > 0.5 GeV/c, |h| < 1, relative to jet#1 (rotated to 270o) for “back-to-back events” with 30 < ET(jet#1) < 70 GeV. Rick Field – Florida/CDF/CMS
0.5 1.0 1.5 2.0 Jet Topologies QCD Four Jet Topology QCD Three Jet Topology Polar Plot • Shows the Df dependence of the “associated” charged particle density, dNchg/dhdf, pT > 0.5 GeV/c, |h| < 1, PTmaxT > 2.0 GeV/c (not including PTmaxT) relative to PTmaxT (rotated to 180o) and the charged particle density, dNchg/dhdf, pT > 0.5 GeV/c, |h| < 1, relative to jet#1 (rotated to 270o) for “back-to-back events” with 30 < ET(jet#1) < 70 GeV. Rick Field – Florida/CDF/CMS
“Back-to-Back” vs “Min-Bias”“Associated” Charge Density “Birth” of jet#3 in the “transverse” region! “Back-to-Back” “Associated” Density “Min-Bias” “Associated” Density Log Scale! “Birth” of jet#1 in “min-bias” collisions! • Shows the Df dependence of the “associated” charged particle density, dNchg/dhdf for pT > 0.5 GeV/c, |h| < 1 (not including PTmaxT) relative to PTmaxT (rotated to 180o) for PTmaxT > 2.0 GeV/c, for “back-to-back” events with 30 < ET(jet#1) < 70 GeV. • Shows the data on the Df dependence of the “associated” charged particle density, dNchg/dhdf, pT > 0.5 GeV/c, |h| < 1 (not including PTmax) relative to PTmax (rotated to 180o) for “min-bias” eventswith PTmax > 2.0 GeV/c. Rick Field – Florida/CDF/CMS
“Associated” PTsum DensityPYTHIA Tune A vs HERWIG HERWIG (without multiple parton interactions) does not produce enough “associated” PTsum in the direction of PTmaxT! PTmaxT > 0.5 GeV/c And HERWIG (without multiple parton interactions) does not produce enough PTsum in the direction opposite of PTmaxT! Rick Field – Florida/CDF/CMS
For PTmaxT > 2.0 GeV both PYTHIA and HERWIG produce slightly too much “associated” PTsum in the direction of PTmaxT! “Associated” PTsum DensityPYTHIA Tune A vs HERWIG PTmaxT > 2 GeV/c But HERWIG (without multiple parton interactions) produces too few particles in the direction opposite of PTmaxT! Rick Field – Florida/CDF/CMS
Jet Multiplicity • Shows the data on the number of jets (JetClu, R = 0.7, |h| < 2, ET(jet) > 3 GeV) for “back-to-back” events with 30 < ET(jet#1) < 70 GeV andPTmaxT > 2.0 GeV/c. Max pT in the “transverse” region! HERWIG (without multiple parton interactions) does not have equal amounts of 3 and 4 jet topologies! Data have about equal amounts of 3 and 4 jet topologies! • Compares the (uncorrected) data with PYTHIA Tune A after CDFSIM. • Compares the (uncorrected) data with HERWIG after CDFSIM. Rick Field – Florida/CDF/CMS
“Transverse” <pT> versus“Transverse” Nchg “Leading Jet” “Back-to-Back” Min-Bias • Look at the <pT> of particles in the “transverse” region (pT > 0.5 GeV/c, |h| < 1) versus the number of particles in the “transverse” region: <pT> vs Nchg. • Shows <pT> versus Nchg in the “transverse” region (pT > 0.5 GeV/c, |h| < 1) for “Leading Jet” and “Back-to-Back” events with 30 < ET(jet#1) < 70 GeV compared with “min-bias” collisions. Rick Field – Florida/CDF/CMS
“Transverse 1” Region vs“Transverse 2” Region “Leading Jet” “Back-to-Back” • Use the leading jet to define two “transverse” regions and look at the correlations between “transverse 1” and “transverse 2”. • Shows the average number of charged particles in the “transverse 2” region versus the number of charged particles in the “transverse 1” region for pT > 0.5 GeV/c and |h| < 1 for “Leading Jet” and “Back-to-Back” events. • Shows the average pT of charged particles in the “transverse 2” region versus the number of charged particles in the “transverse 1” region for pT > 0.5 GeV/c and |h| < 1 for “Leading Jet” and “Back-to-Back” events. Rick Field – Florida/CDF/CMS
“Transverse 1” Region vs“Transverse 2” Region Rick Field – Florida/CDF/CMS
Recent CDF Run 2 “Underlying Event” Results • Two Classes of Events: “Leading Jet” and “Back-to-Back”. • Two “Transverse” regions: “transMAX”, “transMIN”, “transDIF”. • Data Corrected to the Particle Level: unlike our previous CDF Run 2 “underlying event” analysis which used JetClu to define “jets” and compared uncorrected data with the QCD Monte-Carlo models after detector simulation, this analysis uses the MidPoint jet algorithm and corrects the observables to the particle level. The corrected observables are then compared with the QCD Monde-Carlo models at the particle level. • For the 1st time we study the energy density in the “transverse” region. The “underlying event” consists of hard initial & final-state radiation plus the “beam-beam remnants” and possible multiple parton interactions. “Transverse” region is very sensitive to the “underlying event”! New CDF Run 2 results (L= 385 pb-1): Rick Field – Florida/CDF/CMS
“Transverse” ObservablesParticle and Detector Level “Leading Jet” “Back-to-Back” Rick Field – Florida/CDF/CMS
“TransMAX/MIN” Nchg DensityPYTHIA Tune A vs HERWIG “Back-to-Back” “Leading Jet” • Shows the charged particle density, dNchg/dhdf, in the “transMAX” and “transMIN” region (pT > 0.5 GeV/c, |h| < 1) versus PT(jet#1) for “Leading Jet” and “Back-to-Back” events. • Compares the (corrected) data with PYTHIA Tune A (with MPI) and HERWIG (without MPI) at the particle level. Rick Field – Florida/CDF/CMS
“Transverse” <PT> and <PTmax>PYTHIA Tune A vs HERWIG “Back-to-Back” “Leading Jet” • Shows the average transverse momentum, <PT>, and <PTmax> for charged particles in the “transverse” region (pT > 0.5 GeV/c, |h| < 1) versus PT(jet#1) for “Leading Jet” and “Back-to-Back” events. • Compares the (corrected) data with PYTHIA Tune A (with MPI) and HERWIG (without MPI) at the particle level. Rick Field – Florida/CDF/CMS
“TransMAX/MIN” ETsum DensityPYTHIA Tune A vs HERWIG “Back-to-Back” “Leading Jet” • Shows the ETsum density, dETsum/dhdf, in the “transMAX” and “transMIN” region (all particles |h| < 1) versus PT(jet#1) for “Leading Jet” and “Back-to-Back” events. • Compares the (corrected) data with PYTHIA Tune A (with MPI) and HERWIG (without MPI) at the particle level. Rick Field – Florida/CDF/CMS
“TransDIF” ETsum DensityPYTHIA Tune A vs HERWIG “Leading Jet” “Back-to-Back” “transDIF” is very sensitive to the “hard scattering” component of the “underlying event”! • Use the leading jet to define the MAX and MIN “transverse” regions on an event-by-event basis with MAX (MIN) having the largest (smallest) charged PTsum density. • Shows the “transDIF” = MAX-MIN ETsum density, dETsum/dhdf, for all particles (|h| < 1) versus PT(jet#1) for “Leading Jet” and “Back-to-Back” events. Rick Field – Florida/CDF/CMS
“TransMAX/MIN” ETsum DensityPYTHIA Tune A vs JIMMY JIMMY was tuned to fit the energy density in the “transverse” region for “leading jet” events! “Back-to-Back” “Leading Jet” • Shows the ETsum density, dETsum/dhdf, in the “transMAX” and “transMIN” region (all particles |h| < 1) versus PT(jet#1) for “Leading Jet” and “Back-to-Back” events. • Compares the (corrected) data with PYTHIA Tune A (with MPI) and a tuned version of JIMMY (with MPI, PTJIM = 3.25 GeV/c, default = 2.5 GeV/c) at the particle level. JIMMY: MPI J. M. Butterworth J. R. Forshaw M. H. Seymour JIMMY Runs with HERWIG and adds multiple parton interactions! Rick Field – Florida/CDF/CMS
“TransMAX/MIN” PTsum DensityPYTHIA Tune A vs JIMMY “Back-to-Back” “Leading Jet” • Shows the charged PTsum density, dETsum/dhdf, in the “transMAX” and “transMIN” region (pT > 0.5 GeV/c, |h| < 1) versus PT(jet#1) for “Leading Jet” and “Back-to-Back” events. • Compares the (corrected) data with PYTHIA Tune A (with MPI) and a tuned version of JIMMY (with MPI, PTJIM = 3.25 GeV/c) at the particle level. Rick Field – Florida/CDF/CMS
“TransMAX/MIN” Nchg DensityPYTHIA Tune A vs JIMMY “Back-to-Back” “Leading Jet” • Shows the charged particle density, dNchg/dhdf, in the “transMAX” and “transMIN” region (pT > 0.5 GeV/c, |h| < 1) versus PT(jet#1) for “Leading Jet” and “Back-to-Back” events. • Compares the (corrected) data with PYTHIA Tune A (with MPI) and a tuned version of JIMMY (with MPI, PTJIM = 3.25 GeV/c) at the particle level. Rick Field – Florida/CDF/CMS
“Transverse” <PT>PYTHIA Tune A vs JIMMY “Back-to-Back” “Leading Jet” • Shows the charged particle <PT> in the “transverse” region (pT > 0.5 GeV/c, |h| < 1) versus PT(jet#1) for “Leading Jet” and “Back-to-Back” events. • Compares the (corrected) data with PYTHIA Tune A (with MPI) and HERWIG and a tuned version of JIMMY (with MPI, PTJIM = 3.25 GeV/c) at the particle level. Rick Field – Florida/CDF/CMS
Possible Scenario?? • PYTHIA Tune A fits the charged particle PTsum density for pT > 0.5 GeV/c, but it does not produce enough ETsum for towers with ET > 0.1 GeV. • It is possible that there is a sharp rise in the number of particles in the “underlying event” at low pT (i.e. pT < 0.5 GeV/c). • Perhaps there are two components, a vary “soft” beam-beam remnant component (Gaussian or exponential) and a “hard” multiple interaction component. Rick Field – Florida/CDF/CMS
CDF Run 1 PT(Z) PYTHIA 6.2 CTEQ5L • Shows the Run 1 Z-boson pT distribution (<pT(Z)> ≈ 11.5 GeV/c) compared with PYTHIA Tune A (<pT(Z)> = 9.7 GeV/c), Tune A25 (<pT(Z)> = 10.1 GeV/c), and Tune A50 (<pT(Z)> = 11.2 GeV/c). UE Parameters ISR Parameter Vary the intrensic KT! Intrensic KT Rick Field – Florida/CDF/CMS
CDF Run 1 PT(Z) Tune used by the CDF-EWK group! PYTHIA 6.2 CTEQ5L • Shows the Run 1 Z-boson pT distribution (<pT(Z)> ≈ 11.5 GeV/c) compared with PYTHIA Tune A (<pT(Z)> = 9.7 GeV/c), and PYTHIA Tune AW (<pT(Z)> = 11.7 GeV/c). UE Parameters ISR Parameters Effective Q cut-off, below which space-like showers are not evolved. Intrensic KT The Q2 = kT2 in as for space-like showers is scaled by PARP(64)! Rick Field – Florida/CDF/CMS
Df Jet#1-Jet#2 Jet#1-Jet#2 Df Distribution Jet-Jet Correlations (DØ) • MidPoint Cone Algorithm (R = 0.7, fmerge = 0.5) • L= 150 pb-1 (Phys. Rev. Lett. 94 221801 (2005)) • Data/NLO agreement good. Data/HERWIG agreement good. • Data/PYTHIA agreement good provided PARP(67) = 1.0→4.0 (i.e. like Tune A, best fit 2.5). Rick Field – Florida/CDF/CMS
CDF Run 1 PT(Z) PYTHIA 6.2 CTEQ5L • Shows the Run 1 Z-boson pT distribution (<pT(Z)> ≈ 11.5 GeV/c) compared with PYTHIA Tune DW, and HERWIG. UE Parameters ISR Parameters Tune DW uses D0’s perfered value of PARP(67)! Intrensic KT Tune DW has a lower value of PARP(67) and slightly more MPI! Rick Field – Florida/CDF/CMS
“Transverse” Nchg Density Three different amounts of MPI! PYTHIA 6.2 CTEQ5L • Shows the “transverse” charged particle density, dN/dhdf, versus PT(jet#1) for “leading jet” events at 1.96 TeV for PYTHIA Tune A, Tune AW, Tune DW, Tune BW, and HERWIG (without MPI). UE Parameters ISR Parameter • Shows the “transverse” charged particle density, dN/dhdf, versus PT(jet#1) for “leading jet” events at 1.96 TeV for Tune DW, ATLAS, and HERWIG (without MPI). Three different amounts of ISR! Intrensic KT Rick Field – Florida/CDF/CMS
“Transverse” PTsum Density PYTHIA 6.2 CTEQ5L Three different amounts of MPI! • Shows the “transverse” charged PTsum density, dPT/dhdf, versus PT(jet#1) for “leading jet” events at 1.96 TeV for PYTHIA Tune A, Tune AW, Tune DW, Tune BW, and HERWIG (without MPI). UE Parameters ISR Parameter • Shows the “transverse” charged PTsum density, dPT/dhdf, versus PT(jet#1) for “leading jet” events at 1.96 TeV for Tune DW, ATLAS, and HERWIG (without MPI). Three different amounts of ISR! Intrensic KT Rick Field – Florida/CDF/CMS
PYTHIA 6.2 Tunes PYTHIA 6.2 CTEQ5L CDF Run 2 Data! • Shows the “transverse” charged particle density, dN/dhdf, versus PT(jet#1) for “leading jet” events at 1.96 TeV for Tune A, DW, ATLAS, and HERWIG (without MPI). • Shows the “transverse” charged average pT, versus PT(jet#1) for “leading jet” events at 1.96 TeV for Tune A, DW, ATLAS, and HERWIG (without MPI). • Shows the “transverse” charged PTsum density, dPT/dhdf, versus PT(jet#1) for “leading jet” events at 1.96 TeV for Tune A, DW, ATLAS, and HERWIG (without MPI). Identical to DW at 1.96 TeV but uses ATLAS extrapolation to the LHC! Rick Field – Florida/CDF/CMS
The “Underlying Event” inHigh PT Jet Production (LHC) • Charged particle density in the “Transverse” region versus PT(jet#1) at 1.96 TeV for PY Tune AW and HERWIG (without MPI). Charged particle density versus PT(jet#1) The “Underlying Event” “Underlying event” much more active at the LHC! • Charged particle density in the “Transverse” region versus PT(jet#1) at 14 TeV for PY Tune AW and HERWIG (without MPI). Rick Field – Florida/CDF/CMS
Bruce Knuteson Khaldoun Makhoul Georgios Choudalakis Markus Klute Conor Henderson Ray Culbertson Gene Flanagan MIT Search Scheme: Vista/Sleuth Exclusive 3 Jet Final State Challenge CDF Data At least 1 Jet (“trigger” jet) (PT > 40 GeV/c, |h| < 1.0) Normalized to 1 PYTHIA Tune A Exactly 3 jets (PT > 20 GeV/c, |h| < 2.5) R(j2,j3) Order Jets by PT Jet1 highest PT, etc. Rick Field – Florida/CDF/CMS
R > 1.0 Exc3J: R(j2,j3) Normalized The data have more 3 jet events with small R(j2,j3)!? • Let Ntrig40 equal the number of events with at least one jet with PT > 40 geV and |h| < 1.0 (this is the “offline” trigger). • Let N3Jexc20 equal the number of events with exactly three jets with PT > 20 GeV/c and |h| < 2.5 which also have at least one jet with PT > 40 GeV/c and |h| < 1.0. Normalized to N3JexcFr • Let N3JexcFr = N3Jexc20/Ntrig40. The is the fraction of the “offline” trigger events that are exclusive 3-jet events. • The CDF data on dN/dR(j2,j3) at 1.96 TeV compared with PYTHIA Tune AW (PARP(67)=4), Tune DW (PARP(67)=2.5), Tune BW (PARP(67)=1). • PARP(67) affects the initial-state radiation which contributes primarily to the region R(j2,j3) > 1.0. Rick Field – Florida/CDF/CMS
R < 1.0 3Jexc R(j2,j3) Normalized I do not understand the excess number of events with R(j2,j3) < 1.0. Perhaps this is related to the “soft energy” problem?? For now the best tune is PYTHIA Tune DW. • Let Ntrig40 equal the number of events with at least one jet with PT > 40 geV and |h| < 1.0 (this is the “offline” trigger). • Let N3Jexc20 equal the number of events with exactly three jets with PT > 20 GeV/c and |h| < 2.5 which also have at least one jet with PT > 40 GeV/c and |h| < 1.0. Normalized to N3JexcFr • Let N3JexcFr = N3Jexc20/Ntrig40. The is the fraction of the “offline” trigger events that are exclusive 3-jet events. • The CDF data on dN/dR(j2,j3) at 1.96 TeV compared with PYTHIA Tune DW (PARP(67)=2.5) and HERWIG (without MPI). • Final-State radiation contributes to the region R(j2,j3) < 1.0. • If you ignore the normalization and normalize all the distributions to one then the data prefer Tune BW, but I believe this is misleading. Rick Field – Florida/CDF/CMS
“Hard Scattering” Component QCD Monte-Carlo Models:Lepton-Pair Production • Start with the perturbative Drell-Yan muon pair production and add initial-state gluon radiation (in the leading log approximation or modified leading log approximation). “Underlying Event” • The “underlying event” consists of the “beam-beam remnants” and from particles arising from soft or semi-soft multiple parton interactions (MPI). • Of course the outgoing colored partons fragment into hadron “jet” and inevitably “underlying event” observables receive contributions from initial and final-state radiation. Rick Field – Florida/CDF/CMS
The “Central” Regionin Drell-Yan Production Look at the charged particle density and the PTsum density in the “central” region! • Look at the “central” region after removing the lepton-pair. • Study the charged particles (pT > 0.5 GeV/c, |h| < 1) and form the charged particle density, dNchg/dhdf, and the charged scalar pT sum density, dPTsum/dhdf, by dividing by the area in h-f space. Charged Particles(pT > 0.5 GeV/c, |h| < 1) After removing the lepton-pair everything else is the “underlying event”! Rick Field – Florida/CDF/CMS
Drell-Yan Production (Run 2 vs LHC) • Average Lepton-Pair transverse momentum at the Tevatron and the LHC for PYTHIA Tune DW and HERWIG (without MPI). Lepton-Pair Transverse Momentum <pT(m+m-)> is much larger at the LHC! Shapes of the pT(m+m-) distribution at the Z-boson mass. Z • Shape of the Lepton-Pair pT distribution at the Z-boson mass at the Tevatron and the LHC for PYTHIA Tune DW and HERWIG (without MPI). Rick Field – Florida/CDF/CMS
The “Underlying Event” inDrell-Yan Production • Charged particle density versus the lepton-pair invariant mass at 1.96 TeV for PYTHIA Tune AW and HERWIG (without MPI). The “Underlying Event” Charged particle density versus M(pair) HERWIG (without MPI) is much less active than PY Tune AW (with MPI)! “Underlying event” much more active at the LHC! Z Z • Charged particle density versus the lepton-pair invariant mass at 14 TeV for PYTHIA Tune AW and HERWIG (without MPI). Rick Field – Florida/CDF/CMS