Download
1 / 23
230 likes | 330 Views
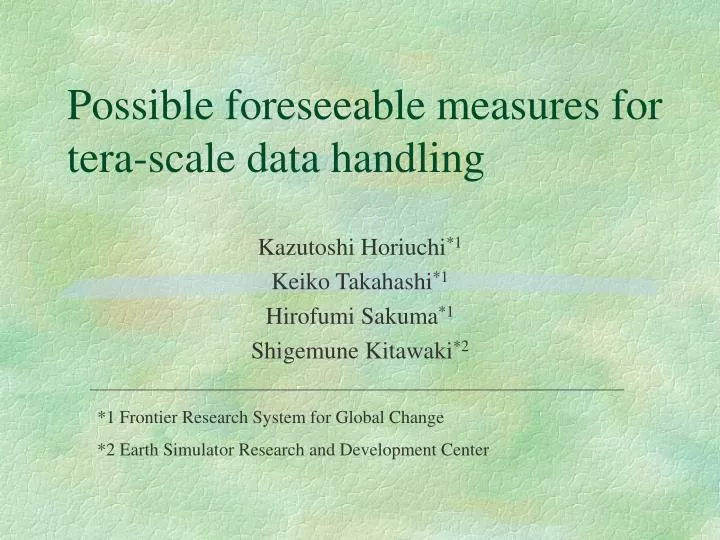
Possible foreseeable measures for tera-scale data handling. Kazutoshi Horiuchi *1 Keiko Takahashi *1 Hirofumi Sakuma *1 Shigemune Kitawaki *2. *1 Frontier Research System for Global Change *2 Earth Simulator Research and Development Center.

E N D
Possible foreseeable measures for tera-scale data handling Kazutoshi Horiuchi*1 Keiko Takahashi*1 Hirofumi Sakuma*1 Shigemune Kitawaki*2 *1 Frontier Research System for Global Change *2 Earth Simulator Research and Development Center
Global Change Prediction by an Integrated Three-in-one Research FORSGC Observation Assimilation data for validation Accurate & spatially representative data Accurate & spatially representative data Optimal monitoring plan High performance computing Numerical Simulation Process Study & Modeling ESRDC Sophisticated high resolution model FRSGC
Frontier Research System for Global Change (Project) (Common) Goal Global Change Prediction Activities • Process Study • Model Development Funding Bodies • Japan Marine Science and Technology Center (JAMSTEC) • National Space Development Agency (NASDA)
On-Going Process Studies • Climate Variations Research • Hydrological Cycle Research • Global Warming Research • Atmospheric Composition Research • Ecosystem Change Research • Research of International Pacific Research Center • Research of International Arctic Research Center
Current Target of Model Development Group • Coupled Model(now based on CCSR/NIES, MOM3) • for Climate Change Experiment • Cloud Cluster Resolving Ultra High Resolution Model • for Prediction of Typhoon/Baiu Evolution • Coupled Chemistry - Global Climate Model • for Prediction of Atmospheric Composition Change • Next Generation Model(Cubic/Icosahedral Grid, CIP method) • 4DVAR Ocean Data Assimilation Model • (based on MOM3)
Current Target of Coupled Model Developmenton ES • High Resolution: • Atmosphere Model part: T213L50 • Ocean Model part: 1/10 deg. 53 layers • High Performance • Estimation of Acceleration ratio • Atmosphere Model: (under estimation) • Ocean Model: 300 ~ 400 times (480PEs;60Ns) 5 days for 100 years integration
Earth Simulator Research Development Center (Project) (Common) Goal Global Change Prediction Activities • Development of High Speed Parallel Computer • Understanding and Prediction of Global Change Funding Bodies • Japan Atomic Energy Research Institute (JAERI) • National Space Development Agency (NASDA) • Japan Marine Science and Technology Center (JAMSTEC)
Characteristics of Earth Simulator • Peak Performance: 40TFLOPS • Number of Processor Nodes: 640 • Number of PEs: 5120 (8PEs/Node) • Interconnection Network: 16GB/s • Total Memory: 10TB • Total Secondary Storage: 600-700TB • Total Mass Storage: 1PB(84Drives)
16 Nodes 16 Nodes 16 Nodes … 16 Nodes MM MM MM MM MM MM VP 1 VP 1 VP 1 VP 1 VP 1 VP 1 VP 7 VP 7 VP 7 VP 7 VP 7 VP 7 VP 0 VP 0 VP 0 VP 0 VP 0 VP 0 … … … … … … Fiber Channel Switch … … Fiber Channel Switch … Architecture of Earth Simulator Interconnection Network WAN TSS Cluster *1 Batch Cluster *39 WS WS … WS Mass Storage System FS 84 Drives …
I/O Model in Distributed Memory Parallel Computer communication … … P P P P P P … P P P (Unix) File (Data-Distributed Unix) Files Parallel File
Parallel File System on ES To handle distributed data as a logically single file has advantages to develop application softwares and to process post processings. Distribution Mechanism 1 D1 P1 1 4 7 1 2 3 M1 M2 2 P2 2 5 8 D2 4 5 6 3 Proc no.: Np Dist. Size: Sd Dist. Pattern: P= BLOCK/CYCLIC Disk no.: Nd Striping Size: Ss 4 P3 3 6 9 7 8 9 D3 5 6 7 8 P 9 1 2 3 P File Image 4 5 6 P 7 8 9 Processors Disks
Support for Parallel File on Several Levels User Program Compiler C F90 HPF Library FAL F90-RTP MPI-IO HPF-RTP PFS UFS PFS UFS PFS Operating System (with PFS) Hardware …… Unix File Parallel File
Review of Model Development Flow Results of Process Study Improvement of Model Execution with Model Evaluation of Results Input Data Output Data • Analysis • Visualization Resources for Process Study
Is it Satisfactory about I/O performance? • The faster super computers are, the larger the amount of the output data generated by large-scale simulations. • The large amount of data is stored to secondary storages and/or mass storages whose devices are slower. • Is it satisfactory about I/O performance ?
Amount of Input/Output Data -Coupled Model • To answer the question, the following cases are investigated . • Case I: 1000 Years Integration for the Prediction of Global Warming, Decadal Variability, etc. • Case II: 50 Years Integration for the Analysis of El nino, Dipole Mode Events, Asian Monsoon, etc.
Amount of Input/Output Data -Coupled Model • Atmosphere Model part • Ocean Model part NOTE: The amount of output data is estimated as 2 byte integer elements
Estimated I/O time - Coupled Model NOTE: Time is estimated only on drive’s I/O rate. Multiple drives are assumed to be independent.
Summary of I/O Performance (from the viewpoint of Model Development) • Disk I/O time might be satisfactory. • 0.2% of the simulation time • Less than 2 hours as a total • Tape I/O time might be conspicuous. • 11-35% of the simulation time for 8 tape drives • 1-6 days for 8 tape drives This inefficiency might be critical for iterative works such as model development
How to Shorten Turn Around Time of Model Development • Give up outputting numerical data. • Output necessary minimum data. • Output full data, with executing tape I/O and simulations in parallel, and with tape I/O library being able to extract necessary minimum data for post processing.
Shortening of TAT by Giving up Outputting Numerical Data Elapsed time for the concurrent visualization with RVSLIB in the batch processing mode on SX-4 1.6M grid (169x92x101) 6.2M grid (337x183x101) Elapsed time (h) Time increase (%) Elapsed time (h) Time increase (%) - - CFD solver only 14.5 67.5 + fixed camera 14.7 1.9 68.0 0.79 + moving camera 14.9 3.0 68.1 0.98 • The number of computational time steps was 10000. • Contour and tracers were displayed at every 10 time steps and visualized animation was stored in a file. • Time integration for moving the tracers was done at every time step for greater accuracy. * This result was provided by NEC
Shortening of TAT by Outputting Necessary Minimum Data This may be Know-Hows of using ES • “Browse sets”, into which the large amount of output data is abstracted (spatially and/or temporally) within simulations, should be stored. • Specific regions of output data should be stored.
Shortening of TAT by Enhancement of Tape I/O Library for Full Output Data • Tape I/O should be executed with simulations in parallel. • In mass storages, output data should be re-organized, and small subsets which are needed for post processing should be able to be extracted. This may be requirements for the improvement of ES
Conclusion • I/O performance was roughly estimated and I/O problem was apprehended. • I/O problem would be avoided with concurrent visualization and/or know-how of the usage. • However we would like to examine the efficient technique for handling the large amount of data continuously to realize comfortable environment for global change prediction.