Download
1 / 20
200 likes | 307 Views
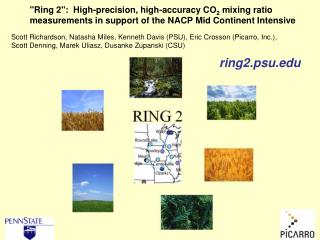
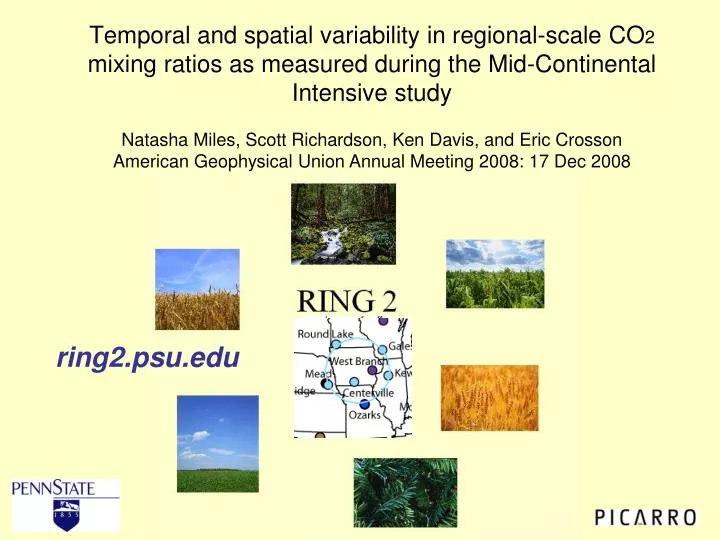
Temporal and spatial variability in regional-scale CO 2 mixing ratios as measured during the Mid-Continental Intensive study. Natasha Miles, Scott Richardson, Ken Davis, and Eric Crosson American Geophysical Union Annual Meeting 2008: 17 Dec 2008. ring2.psu.edu. Outline.

E N D
Temporal and spatial variability in regional-scale CO2 mixing ratios as measured during the Mid-Continental Intensive study Natasha Miles, Scott Richardson, Ken Davis, and Eric Crosson American Geophysical Union Annual Meeting 2008: 17 Dec 2008 ring2.psu.edu
Outline • Mid Continental Intensive, Ring 2 • Temporal variability • Spatial gradients • Seasonal cycle • Comparison to NOAA-ESRL CarbonTracker • June 2008 flood in midwest • Explaining small and large spatial gradients using a regional flux model (forwards)
“Ring 2” Cavity Ring- Down systems PSU Ameriflux systems NOAA Tall Towers NACP Mid-Continental Intensive The role of Ring 2 in the Mid-Continent Intensive • Overall goal: Seek convergence between top-down (tower-based) and bottom-up (inventory-based) ecological estimates of the regional flux • Focus on upper Midwest of the U.S. • Add regional network of 5 communications-tower based atmospheric CO2 obs in the midcontinent intensive region • April/May 2007 through October 2008 • Plan: to “oversample” the atmosphere in the study region for more than a full year • Inversions to produce maps of fluxes of CO2 for region (CSU) WLEF ~ 500 km
Instrumentation Details: Ring 2 • Cavity ring-down spectroscopy (Picarro, Inc.) • Long-term stability • Much reduced need for calibration over NDIR methods • Both [CO2] and [H2O] are measured • 30 and 110-140 m AGL • Quality control • Two reference gases at each site, sampled ~daily • Round-robin tests (Feb and Nov 08) • Uncertainty: < 0.2 ppm
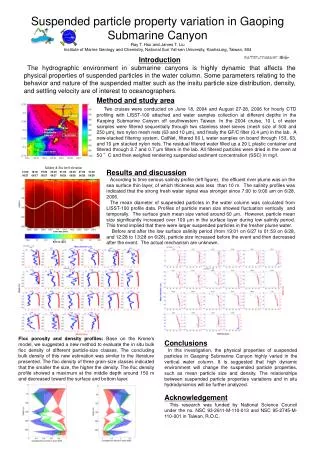
Synoptic variability in boundary-layer CO2 mixing ratios • Seasonal drawdown • Differences amongst the sites • 2007 vs 2008 • Day to day variability
Synoptic variability in boundary-layer CO2 mixing ratios • Seasonal drawdown • Differences amongst the sites • 2007 vs 2008 • Day to day variability • Difference in daily value from one day to the next: as large as 10-30 ppm
Temporal variability: Night – Day [CO2] • Difference between nighttime and daytime values at ~120 m AGL can be over 80 ppm for Ring 2 • Average magnitude of the diurnal cycle at 122 m for July at LEF: 10 ppm (1995-1997) (Bakwin et al. 1998)
Temporal variability: Night – Day [CO2] Ring2 LEF • Difference between nighttime and daytime values at ~120 m AGL can be over 80 ppm for Ring 2 • Average magnitude of the diurnal cycle at 122 m for July at LEF: 10 ppm (1995-1997) (Bakwin et al. 1998)
Spatial gradient magnitude (daytime): Growing seasons 2007-08 • Majority < 0.02 ppm/km • But in 6% of cases, the spatial gradient is between 0.04 and 0.06 ppm/km (Daytime!) % of site-days • Largest difference amongst the sites for each daily value • Seasonal pattern • Differences as large as 40 - 50 ppm between Ring 2 sites! Daytime! • Significant day-to-day variability
Seasonal cycle • Strong coherent seasonal cycle across stations • West Branch (wbi) differs significantly from 2007 to 2008 • Large variance in seasonal drawdown, despite being separated by, at most, 550 km. (mm, ce, lef) vs (kw, rl, wbi) mlo
Seasonal cycle • Strong coherent seasonal cycle across stations • West Branch (wbi) differs significantly from 2007 to 2008 • Large variance in seasonal drawdown, despite being separated by, at most, 550 km. (mm, ce, lef) vs (kw, rl, wbi) mlo
Seasonal cycle • Strong coherent seasonal cycle across stations • West Branch (wbi) differs significantly from 2007 to 2008 • Large variance in seasonal drawdown, despite being separated by, at most, 550 km. (mm, ce, lef) vs (kw, rl, wbi) mlo
Corn for Grain 2007Yield per Harvested Acre by County Dominant vegetation map Courtesy of K. Corbin
NOAA-ESRL Carbon Tracker Ring2 sites not included as input for 2007 http://carbontracker.noaa.gov
2007 14-day smoother applied to CT output mid-afternoon values only (19:30 GMT) Overall drawdown in CT2008 is too weak, but some features of modeled variability are consistent with obs, e.g., there is a lot of variability and MM has less drawdown than WBI, RL and KW in both model and obs. A. Andrews
Cedar Rapids, IA Don Becker (USGS) Dell Creek breach of Lake Delton, WI U.S. Air Force Flooding in the Midwest: June 2008
Seasonal cycle • Strong coherent seasonal cycle across stations • West Branch (wbi) differs significantly from 2007 to 2008 • Large variance in seasonal drawdown, despite being separated by, at most, 550 km (mm, ce, lef) vs (kw, rl, wbi)
Delay in seasonal drawdown • 2008 growing season is uniformly delayed by about one month, compared to 2007 • Effect of June 2008 flood? • Recovery: increased uptake later in the growing season 2007 2008 2007 solid 2008 dashed
Regional flux model: forward results B51A-0364 Corbin et al. Effects of Agricultural Production on Regional Variations of Atmospheric CO2 Concentrations B51A-0355 Lokupitiya et al. Evaluation of the performance of SiBCrop model in predicting carbon fluxes and crop yields in the croplands of the US mid continental region SiB3-RAMS coupled with crop phenology model for corn and soybean Addition of crops greatly improved model’s agreement with obs Gradients of daily minimum value: obs vs model Simulated CO2 at 120 m above ground level on 16 July 2007, illustrating advective controls on CO2 gradients observed across the Ring2 towers
Summary • Temporal variability • diurnal cycle magnitude large compared to LEF • 2008 flood in the Midwest US • Spatial gradients: large difference between sites despite relatively small site separations • Seasonal cycle: • difference amongst sites, some with very large seasonal drawdown • Comparisons to NOAA-ESRL CarbonTracker • Weak overall drawdown, but good variability