Download
1 / 15
150 likes | 288 Views
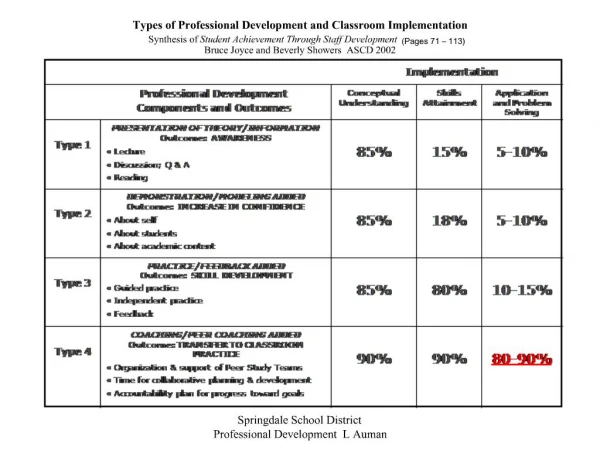
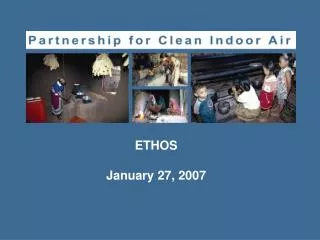
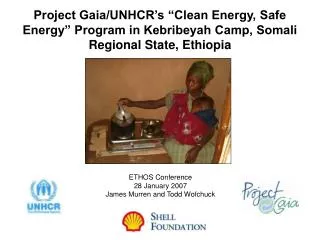
Performance Testing to Monitor Improved Stove Interventions Experiences from Shell Foundation’s Household Energy and Health Pilot Phase. GIRA. GIRA. Dev. Alternatives. Presented by Rob Bailis at the 2007 ETHOS Conference in Kirkland, WA 26-28 January, 2007. Partners. Dev. Alt.

E N D
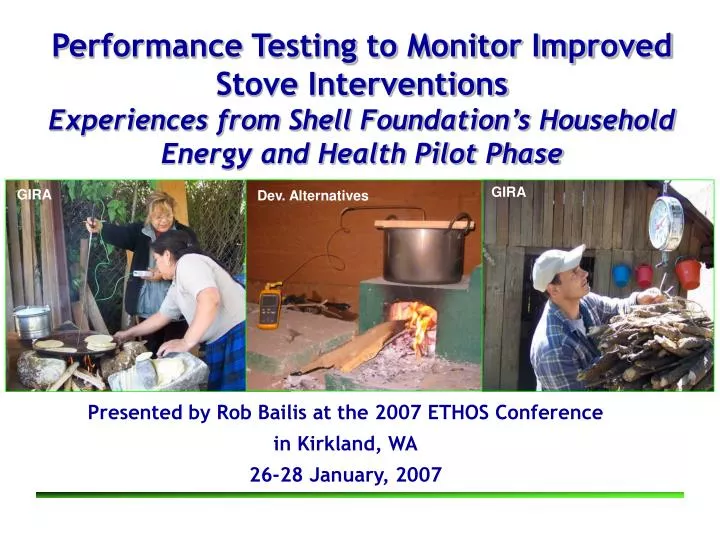
Performance Testing to Monitor Improved Stove InterventionsExperiences from Shell Foundation’s Household Energy and Health Pilot Phase GIRA GIRA Dev. Alternatives Presented by Rob Bailis at the 2007 ETHOS Conference in Kirkland, WA 26-28 January, 2007
Partners Dev. Alt • Donor - Shell Foundation • NGOs • GIRA (Mexico) • HELPS (Guatemala) • DA (India) • ARTI (India) • UC Berkeley - SPH and ERG HELPS All NGOs promote high-mass stoves GIRA Rob Bailis - Yale School of Forestry and Environmental Studies
A question… • What constitutes Stove Performance and how can we measure it? • Efficiency • Time • Fuel consumption • Emissions/air quality • Convenience • Adoption rates Rob Bailis - Yale School of Forestry and Environmental Studies
Objectives • Develop simple replicable protocols for SP M&E: • For use by SF-HEH grantees • For dissemination to the broader stove community • Understand the most appropriate way to assess SP • What is the appropriate balance between standardized tests and tests that are tailored to local conditions? • Assess how much fuel ICs actually save • Understand the relationship between lab and field tests Rob Bailis - Yale School of Forestry and Environmental Studies
We proposed: a lab component WBT CCT and a field component Daily fuel consumption (converted into energy) Qualitative surveys The protocols Aprovecho GIRA Rob Bailis - Yale School of Forestry and Environmental Studies
Results - WBT • Specific consumption GIRA DA ARTI 600 300 300 400 200 200 Grams per liter 200 100 100 0 0 0 HP-CS HP-HS LP HP-CS HP-HS LP HP-CS HP-HS LP Traditional stove HP-CS = High-power Hot Start HP-HS = High-power Cold Start LP = Low-power (Simmering) Improved stove (GIRA – PATSARI; DA-Sukhad; ARTI-Bhagyalaxmi) Standard deviation Rob Bailis - Yale School of Forestry and Environmental Studies
Results - WBT • Specific consumption GIRA DA ARTI 600 300 300 400 200 200 Grams per liter 200 100 100 0 0 0 HP-CS HP-HS LP HP-CS HP-HS LP HP-CS HP-HS LP Traditional stove HP-CS = High-power Hot Start HP-HS = High-power Cold Start LP = Low-power (Simmering) Improved stove (GIRA – PATSARI; DA-Sukhad; ARTI-Bhagyalaxmi) Standard deviation Similar outcome for efficiency, time to boil, etc… Rob Bailis - Yale School of Forestry and Environmental Studies
Why is there a difference? Results - WBT • Summing up the WBT: • No IC was a clear winner • None were clear losers either • At high power, most stoves improved from cold to hot start • Most ICs outperformed trad’l stoves at low power • 6/7 were more efficient • 3/7 reduced SC Rob Bailis - Yale School of Forestry and Environmental Studies
500 y = -9.3x + 343 2 R = 0.32 400 300 Specific consumption (g/l) 500 200 400 y = -14.0x + 412 100 2 R = 0.66 300 y = 0.21x + 190 - Specific consumption (g/l) 2 R = 0.0002 - 5 10 15 20 25 30 35 200 Efficiency (%) 100 - - 5 10 15 20 25 30 35 Efficiency (%) Results - WBT • How does SC relate to thermal efficiency? SC vs. Eff for each phase of WBT High power tests only Low power tests only High and low power tests together • 33 tests phases in total • 22 High-power • 11 Low-power Rob Bailis - Yale School of Forestry and Environmental Studies
Results – CCT (GIRA) Source: GIRA - http://www.gira.org.mx Rob Bailis - Yale School of Forestry and Environmental Studies
90 Traditional stove Improved stove 60 Daily energy use (MJ/person-day) n = 14 30 n = 16 n = 21 n = 32 n = 21 n = 14 0 GIRA: 5-7 day tests ARTI: 1-day tests only DA: 3-day tests Results - KPT GIRA • Much better outcome: • All NGOs showed significant improvement 95% Conf Int. Rob Bailis - Yale School of Forestry and Environmental Studies
Results – KPT & WBT • Links between WBT and KPT High power: time to boil – negative correlation Low power: SC – strong positive correlation Correlations between stove performance indicators derived from the WBT and daily per capita fuel consumption observed in the KPT Rob Bailis - Yale School of Forestry and Environmental Studies
Summing up For the stoves deployed in SF-HEH Pilot Phase: • We find little correlation between the WBT and KPT • All stoves reduced fuel consumption in field tests, despite discouraging WBT results • GIRA’s experience with the CCT shows its utility as a lab-based test • Be wary of fuel consumption “guestimates” derived from lab-based WBT-style tests Rob Bailis - Yale School of Forestry and Environmental Studies
For discussion • What constitutes Stove Performance and how can we measure it? • What is the appropriate balance between standardized tests and tests that are tailored to local conditions? • What can we do with qualitative surveys? • There’s a lot of M&E data out there – we need to understand it better! Rob Bailis - Yale School of Forestry and Environmental Studies
Thank you! Rob Bailis - Yale School of Forestry and Environmental Studies