Download
1 / 63
640 likes | 701 Views
Chapter 8 Estimation. Learning Objectives. In this chapter, you learn: To identify the point and interval estimates. To construct and interpret confidence interval estimates for the mean and the proportion

E N D
Chapter 8 Estimation Lecture 7
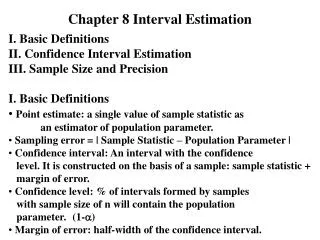
Learning Objectives In this chapter, you learn: • To identify the point and interval estimates. • To construct and interpret confidence interval estimates for the mean and the proportion • How to determine the sample size necessary to develop a confidence interval for the mean or proportion • How to use confidence interval estimates in auditing Lecture 7
Chapter Outline Content of this chapter • Confidence Intervals for the Population Mean, μ • when Population Standard Deviation σ is Known • when Population Standard Deviation σ is Unknown • Confidence Intervals for the Population Proportion, π • Determining the Required Sample Size Lecture 7
Point and Interval Estimates • A point estimate is a single number, • a confidence interval provides additional information about the variability of the estimate Upper Confidence Limit Lower Confidence Limit Point Estimate Width of confidence interval Lecture 7
Point Estimates We can estimate a Population Parameter … with a SampleStatistic (a Point Estimate) μ X Mean π Proportion p Lecture 7
Point Estimates • The Best Linear Unbiased Estimate (BLUE) • Unbiased • Consistent • Sufficient • Efficient Lecture 7
Confidence Intervals • How much uncertainty is associated with a point estimate of a population parameter? • An interval estimate provides more information about a population characteristic than does a point estimate • Such interval estimates are called confidence intervals Lecture 7
Confidence Interval Estimate • An interval gives a range of values: • Takes into consideration variation in sample statistics from sample to sample • Based on observations from 1 sample • Gives information about closeness to unknown population parameters • Stated in terms of level of confidence • e.g. 95% confident, 99% confident • Can never be 100% confident Lecture 7
Confidence Interval Example Cereal fill example • Population has µ = 368 and σ = 15. • If you take a sample of size n = 25 you know • 368 ± 1.96 * 15 / = (362.12, 373.88) contains 95% of the sample means • When you don’t know µ, you use X to estimate µ • If X = 362.3 the interval is 362.3 ± 1.96 * 15 / = (356.42, 368.18) • Since 356.42 ≤ µ ≤ 368.18 the interval based on this sample makes a correct statement about µ. But what about the intervals from other possible samples of size 25? Lecture 7
Confidence Interval Example (continued) Lecture 7
Confidence Interval Example (continued) • In practice you only take one sample of size n • In practice you do not know µ so you do not know if the interval actually contains µ • However you do know that 95% of the intervals formed in this manner will contain µ • Thus, based on the one sample, you actually selected you can be 95% confident your interval will contain µ (this is a 95% confidence interval) Note: 95% confidence is based on the fact that we used Z = 1.96. Lecture 7
I am 95% confident that μ is between 40 & 60. Estimation Process Random Sample Population Mean X = 50 (mean, μ, is unknown) Sample Lecture 7
General Formula • The general formula for all confidence intervals is: Point Estimate ± (Critical Value)(Standard Error) • Where: • Point Estimate is the sample statistic estimating the population parameter of interest • Critical Value is a table value based on the sampling distribution of the point estimate and the desired confidence level • Standard Error is the standard deviation of the point estimate Wh Lecture 7
Confidence Level • Confidence Level • Confidence the interval will contain the unknown population parameter • A percentage (less than 100%) Lecture 7
Confidence Level, (1-) (continued) • Suppose confidence level = 95% • Also written (1 - ) = 0.95, (so = 0.05) • A relative frequency interpretation: • 95% of all the confidence intervals that can be constructed will contain the unknown true parameter • A specific interval either will contain or will not contain the true parameter • No probability involved in a specific interval Lecture 7
Confidence Intervals Confidence Intervals Population Mean Population Proportion σKnown σUnknown Lecture 7
Confidence Interval for μ(σ Known) • Assumptions • Population standard deviation σis known • Population is normally distributed • If population is not normal, use large sample • Confidence interval estimate: where is the point estimate Zα/2 is the normal distribution critical value for a probability of /2 in each tail is the standard error Lecture 7
Finding the Critical Value, Zα/2 • Consider a 95% confidence interval: Zα/2= -1.96 Zα/2= 1.96 Z units: 0 Lower Confidence Limit Upper Confidence Limit X units: Point Estimate Point Estimate Lecture 7
Common Levels of Confidence • Commonly used confidence levels are 90%, 95%, and 99% Confidence Coefficient, Confidence Level Zα/2 value 80% 90% 95% 98% 99% 99.8% 99.9% 0.80 0.90 0.95 0.98 0.99 0.998 0.999 1.28 1.645 1.96 2.33 2.58 3.08 3.27 Lecture 7
Intervals and Level of Confidence Sampling Distribution of the Mean x Intervals extend from to x1 (1-)x100%of intervals constructed contain μ; ()x100% do not. x2 Confidence Intervals Lecture 7
Example • A sample of 11 circuits from a large normal population has a mean resistance of 2.20 ohms. We know from past testing that the population standard deviation is 0.35 ohms. • Determine a 95% confidence interval for the true mean resistance of the population. Lecture 7
Example (continued) • A sample of 11 circuits from a large normal population has a mean resistance of 2.20 ohms. We know from past testing that the population standard deviation is 0.35 ohms. • Solution: Lecture 7
Interpretation • We are 95% confident that the true mean resistance is between 1.9932 and 2.4068 ohms • Although the true mean may or may not be in this interval, 95% of intervals formed in this manner will contain the true mean Lecture 7
Confidence Intervals Confidence Intervals Population Mean Population Proportion σKnown σUnknown Lecture 7
Do You Ever Truly Know σ? • Probably not! • In virtually all real world business situations, σ is not known. • If there is a situation where σ is known then µ is also known (since to calculate σ you need to know µ.) • If you truly know µ there would be no need to gather a sample to estimate it. Lecture 7
Confidence Interval for μ(σ Unknown) • If the population standard deviation σ is unknown, we can substitute the sample standard deviation, S • This introduces extra uncertainty, since S is variable from sample to sample • So we use the t distribution instead of the normal distribution Lecture 7
Confidence Interval for μ(σ Unknown) (continued) • Assumptions • Population standard deviation is unknown • Population is normally distributed • If population is not normal, use large sample • Use Student’s t Distribution • Confidence Interval Estimate: (where tα/2 is the critical value of the t distribution with n -1 degrees of freedom and an area of α/2 in each tail) Lecture 7
Student’s t Distribution • The t is a family of distributions • The tα/2 value depends on degrees of freedom (d.f.) • Number of observations that are free to vary after sample mean has been calculated d.f. = n - 1 Lecture 7
Degrees of Freedom (df) Idea: Number of observations that are free to vary after sample mean has been calculated Example:Suppose the mean of 3 numbers is 8.0 Let X1 = 7 Let X2 = 8 What isX3? If the mean of these three values is 8.0, then X3must be 9 (i.e., X3 is not free to vary) Here, n = 3, so degrees of freedom = n –1 = 3 – 1 = 2 (2 values can be any numbers, but the third is not free to vary for a given mean) Lecture 7
Student’s t Distribution Note: t Z as n increases Standard Normal (t with df = ∞) t (df = 13) t-distributions are bell-shaped and symmetric, but have ‘fatter’ tails than the normal t (df = 5) t 0 Lecture 7
Student’s t Table Upper Tail Area Let: n = 3 df = n - 1 = 2 = 0.10/2 = 0.05 df .25 .10 .05 1 1.000 3.078 6.314 0.817 1.886 2 2.920 /2 = 0.05 3 0.765 1.638 2.353 The body of the table contains t values, not probabilities 0 t 2.920 Lecture 7
Selected t distribution values With comparison to the Z value Confidence t t t Z Level (10 d.f.)(20 d.f.)(30 d.f.) (∞ d.f.) 0.80 1.372 1.325 1.310 1.28 0.90 1.812 1.725 1.697 1.645 0.95 2.228 2.086 2.042 1.96 0.99 3.169 2.845 2.750 2.58 Note: t Z as n increases Lecture 7
Example of t distribution confidence interval A random sample of n = 25 has X = 50 and S = 8. Form a 95% confidence interval for μ • d.f. = n – 1 = 24, so The confidence interval is 46.698 ≤ μ≤ 53.302 Lecture 7
Example of t distribution confidence interval (continued) • Interpreting this interval requires the assumption that the population you are sampling from is approximately a normal distribution (especially since n is only 25). • This condition can be checked by creating a: • Normal probability plot or • Boxplot Lecture 7
Confidence Intervals Confidence Intervals Population Mean Population Proportion σKnown σUnknown Lecture 7
Confidence Intervals for the Population Proportion, π • An interval estimate for the population proportion ( π ) can be calculated by adding an allowance for uncertainty to the sample proportion ( p ) Lecture 7
Confidence Intervals for the Population Proportion, π (continued) • Recall that the distribution of the sample proportion is approximately normal if the sample size is large, with standard deviation • We will estimate this with sample data: Lecture 7
Confidence Interval Endpoints • Upper and lower confidence limits for the population proportion are calculated with the formula • where • Zα/2 is the standard normal value for the level of confidence desired • p is the sample proportion • n is the sample size • Note: must have np > 5 and n(1-p) > 5 Lecture 7
Example • A random sample of 100 people shows that 25 are left-handed. • Form a 95% confidence interval for the true proportion of left-handers Lecture 7
Example (continued) • A random sample of 100 people shows that 25 are left-handed. Form a 95% confidence interval for the true proportion of left-handers. Lecture 7
Interpretation • We are 95% confident that the true percentage of left-handers in the population is between 16.51% and 33.49%. • Although the interval from 0.1651 to 0.3349 may or may not contain the true proportion, 95% of intervals formed from samples of size 100 in this manner will contain the true proportion. Lecture 7
Determining Sample Size Determining Sample Size For the Mean For the Proportion Lecture 7
Sampling Error • The required sample size can be found to reach a desired margin of error (e) with a specified level of confidence (1 - ) • The margin of error is also called sampling error • the amount of imprecision in the estimate of the population parameter • the amount added and subtracted to the point estimate to form the confidence interval Lecture 7
Determining Sample Size Determining Sample Size For the Mean Sampling error (margin of error) Lecture 7
Determining Sample Size (continued) Determining Sample Size For the Mean Now solve for n to get Lecture 7
Determining Sample Size (continued) • To determine the required sample size for the mean, you must know: • The desired level of confidence (1 - ), which determines the critical value, Zα/2 • The acceptable sampling error, e • The standard deviation, σ Lecture 7
Required Sample Size Example If = 45, what sample size is needed to estimate the mean within ± 5 with 90% confidence? So the required sample size is n = 220 (Always round up) Lecture 7
If σ is unknown • If unknown, σ can be estimated when using the required sample size formula • Use a value for σ that is expected to be at least as large as the true σ • Select a pilot sample and estimate σ with the sample standard deviation, S Lecture 7
Determining Sample Size (continued) Determining Sample Size For the Proportion Now solve for n to get Lecture 7
Determining Sample Size (continued) • To determine the required sample size for the proportion, you must know: • The desired level of confidence (1 - ), which determines the critical value, Zα/2 • The acceptable sampling error, e • The true proportion of events of interest, π • π can be estimated with a pilot sample if necessary (or conservatively use 0.5 as an estimate of π) Lecture 7