Download
1 / 7
70 likes | 167 Views
We will now look at the rate of change, m, on a graph. Introduction to Slope, m. The graph of a linear function is a straight line. We can show the locations of the x and y parts of the points on the graph as below:. Pt. 2. So, we can say. Pt. 1. So, we can say.

E N D
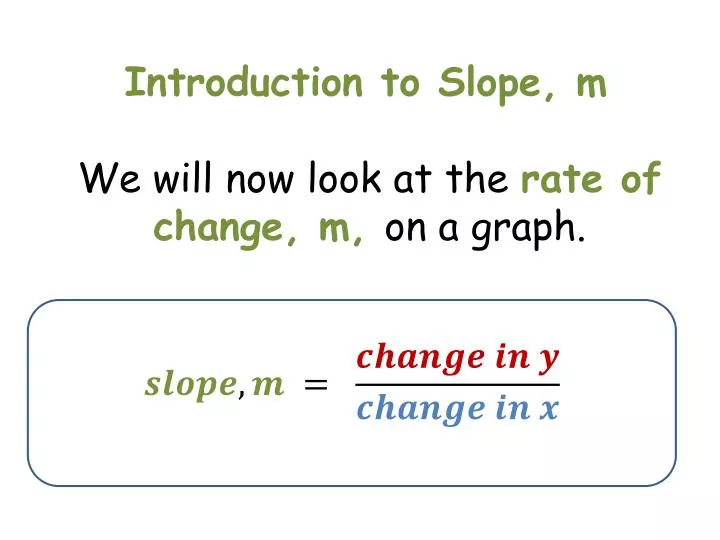
We will now look at the rate of change, m, on a graph. Introduction to Slope, m
The graph of a linear function is a straight line. We can show the locations of the x and y parts of the points on the graph as below: Pt. 2 So, we can say Pt. 1 So, we can say
Find the slope, m, of the linear function: Pt. 2 is the vertical count up (or down which is a negative number) from point to point.is the count Change in y Pt. 1 is 3. is the horizontal count right (or left which is a negative number) from point to point.is the count Change in x is 4. We say when x changes by 4, there is a change in yof 3 from point to point.
Find the slope, m, of the linear function: is the vertical count up (or down which is a negative number) from point to point.is the count Change in x is 1. Pt. 1 Change in y Pt. 2 is the horizontal count right (or left which is a negative number) from point to point.is the count is 2. We say when x changes by 1, there is a change in yof 2 from point to point.
Using the slope, m, can you find another point on the graph? is the vertical count up so we count up 1 from known point, then: Change in x is the horizontal count right so we count right 2. 2 Change in y 1 Pt. 3 This is the location of the new point, pt. 3. Write the new point as an ordered pair:
Find the slope of the linear function, then locate one more point. Write the ordered pair for this point. is the vertical count down. is -2. -2 is the horizontal count right so we count right 3. 3 Pt. 3 is 3. The new point written as an ordered pair is Using the slope as a repeating pattern, we locate a new point.
Find the slope of the linear function, then locate one more point. Write the ordered pair for this point. is also called the rise. is -2. -2 is the run . 3 Pt. 3 is 3. The slope,m, also the rate of change, for this linear function is: