Download
1 / 10
100 likes | 111 Views
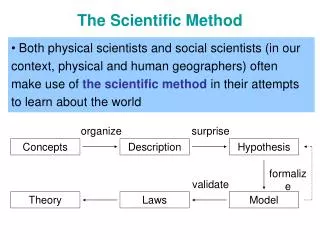
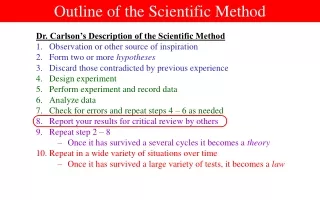
Outline of the Scientific Method. Dr. Carlson’s Description of the Scientific Method Observation or other source of inspiration Form two or more hypotheses Discard those contradicted by previous experience Design experiment Perform experiment and record data Analyze data

E N D
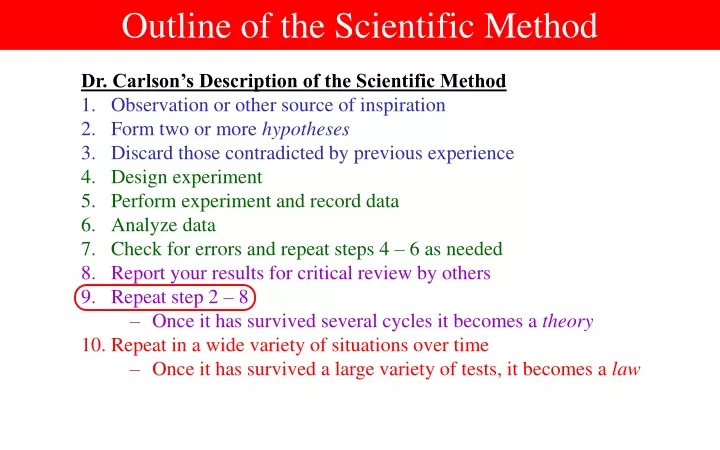
Outline of the Scientific Method Dr. Carlson’s Description of the Scientific Method • Observation or other source of inspiration • Form two or more hypotheses • Discard those contradicted by previous experience • Design experiment • Perform experiment and record data • Analyze data • Check for errors and repeat steps 4 – 6 as needed • Report your results for critical review by others • Repeat step 2 – 8 • Once it has survived several cycles it becomes a theory • Repeat in a wide variety of situations over time • Once it has survived a large variety of tests, it becomes a law
Examining Alternative Hypotheses Repetition is a Good Thing • Generally, surprising scientific results are not accepted by the scientific community until they have undergone scrutiny by multiple experimenters • Often, the results ultimately prove to be caused by something unexpected • Example from my field – the 17 keV neutrino • There were perhaps six experiments that saw the effect • And perhaps four that saw no effect • But most of these were low statistics • It was noted that four of the positive experiments used something called a baffle • It was proposed that the baffle was causing the anomalous results • The experiment was redone without the baffle – and the effect went away • One of the remaining experiments increased statistics – the effect went away • The one remaining experiment was low statistics – and no one believed it
Sometimes We Go Down the Wrong Track • Papers get published based on results that ultimately prove incorrect • But in the long run, we tend to catch the errors
A Positive Example from My Field • Back in the 1970’s, it was discovered that the number of neutrinos coming from the Sun was smaller than predicted • Many explanations proposed • In the 1980’s, one such explanation – the so-called MSW effect – came to the fore • The theory predicted that the neutrinos were being changed from one type to another invisible type • It was predicted that other neutrino detectors – most importantly including the Sudbury Neutrino Observatory – would be able to accurately count all the neutrinos • This and several other experiments all confirmed the MSW hypothesis to be true • We would now regard the MSW hypothesis as a theory
Searching Out Alternative Hypotheses • Once experiments seem to verify a hypothesis, it is still good to consider whether alternatives can explain the pattern • Can we explain the trends seen as being due to random chance? • Could we be confusing cause and effect? • Could the correlations seen have a different cause entirely? • Once we have ruled many of these hypotheses out, the hypothesis has survived a test of time, and becomes a theory
Anthropogenic (Man-Caused) Global Warming Example of How the Scientific Process Works • In the 19th century, it was realized out that carbon dioxide (CO2) is a greenhouse gas • It allows visible light through, which warms the Earth • But it doesn’t let infrared light out, so heat can’t escape • In 1896 ArvidHogbom suggested that human emission of CO2 due to industrial activity would lead to long-term warming of the Earth • But he thought it would be very slow (CO2 production was much lower then) • By 1950’s scientists suspected thatanthropogenic CO2 production would besufficient to cause significant climate change • By 1960 the first accurate measurements ofCO2demonstrated that it was rising • These measurements continue today • By 1965 it was recognized that carbondioxide was likely to cause global warming
A Warming Earth • By the 1980’s it was most scientist’s opinion that human activities would cause warming of the Earth • By this point, satellites capable of measuringmean global temperatures were built, so thatreliable measurements of the effects of globalwarming were possible • These measurements continue today • In 1988 the International Panel on ClimateChange (IPCC) was established to monitorand study global warming • This panel has stated with increasingconfidence that • The Earth is getting substantially warmer • Anthrogogenic causes are the primary driver of this warming
Alternative Hypotheses (1)? • One can always come up with alternative hypotheses • For example, there is evidence that Earth’s climate has fluctuated substantially in the past, even within the time frame when humans were around • Glacial periods (most recent ? – 80th century BCE) • Medieval warm period (10th – 13th century CE) • “Little Ice Age” (16th – 19th century CE) • These were not caused by human activity • We now believe that small variations in Earth’s orbit are responsible for the ice ages • Milankovich cycles • Changes in the past 1000 years are too rapid to be accounted for by these cycles • The Sun’s output of energy varies over time • Solar cycle – eleven year cycle where the Sun brightens and dims • Longer term variations of unknown cause • But we can now directly measure (with satellites) this variation in the Sun’s output • These changes probably do account for the Little Ice Age and the Medieval warm period
Alternative Hypotheses (2)? • One can similarly question the data itself • Could it be due to random chance? • Mean temperatures do fluctuate from year to year • But the 10 hottest years of all have all been in last 20 years • Also, much early data relied on temperature stations • Many of these areas have become more urbanized over time • The process of urbanization causes local temperatures to rise • Concrete is hotter than vegetation, for example • “Heat Island effect” • It has been found, however, that when corrected for this effect,the Earth is still getting hotter • Bottom line – No plausible alternative hypothesis has been found • Most (~95%) climate scientists accept anthropogenic global warming Hottest • 2016 • 2015 • 2017 • 2014 • 2010 • 2005 • 2013 • 2009 • 1998 • 2007
Global Warming: Hypothesis, Theory, Law • I think most scientists would now say that the idea that carbon dioxide in the atmosphere causes global warming started out as a hypothesis • Although it made sense, there were a lot of unknowns • Size of effect • Relative importance of CO2 vs. other contributors • Feedback effects • Etc. • Many of these uncertainties have been eliminated • We can now label this as a theory • To be a law, it must be tested in a large variety of circumstances • We don’t know to what extent CO2 played a major role in the heating of the Earth in the past • We have a little bit of evidence that it is an effect on other planets • Venus is hot due to thick CO2 atmosphere • But since we don’t know how it all fits together, it’s still not a law