Download

1 / 7
70 likes | 238 Views
Definition of Lean. “ A systematic approach to identifying and eliminating waste (non-value-added activities) in a company ’ s operations. Lean emphasizes flowing the product at the pull of the customer. ” Lean is implemented through both rapid and continuous improvement.

E N D
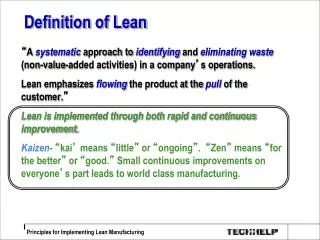
Definition of Lean “A systematic approach to identifying and eliminating waste (non-value-added activities) in a company’s operations. Lean emphasizes flowing the product at the pull of the customer.” Lean is implemented through both rapid andcontinuous improvement. Kaizen- “kai’ means “little” or “ongoing”. “Zen” means “for the better” or “good.” Small continuous improvements on everyone’s part leads to world class manufacturing.
Pull/Kanban Cellular/Flow TPM Quality at Source POUS Quick Changeover Standardized Work Batch Reduction Teams 5S System Visual Plant Layout Value Stream Mapping Lean Building Blocks KAIZEN
Kaizen Methodology • Select project/opportunity • Study design principles/best practices from previous projects • Prepare an analysis of the current state • Generate proposed solutions (future state) • Develop proposed solution • Get feedback on proposed solution • Revise and implement solution • Measure impact • Disseminate
5 Whys Question asking method used to discover root cause of a problem • Highlights cause – effect relationship • Identify problems – not just symptoms • Have to ask the right why questions • Could be any number of whys Example: • My car will not start. (the problem) • Why? - The battery is dead. (first why) • Why? - The alternator is not functioning. (second why) • Why? - The alternator belt has broken. (third why) • Why? - The alternator belt was well beyond its useful service life and has never been replaced. (fourth why) • Why? - I have not been maintaining my car according to the recommended service schedule. (fifth why, root cause) Excerpt from Wikipedia
Fishbone (Ishikawa) Diagram A cause and effect diagram that highlights the relationships and types of causes Image from Wikipedia Example: http://www.techrepublic.com/article/use-a-fishbone-diagram-to-help-attack-complex-problems/
Spaghetti Diagram Chart that shows the flow of product – highlights inefficiencies in layout Ship QC Rec Raw Stock QC Screw Machine Shear Stamp Lathe Drill Assembly Brake Mill Weld Grind Finish Parts Stock
5S Scorecard Checklist to evaluate current status of 5S application and guide future application of 5S 5s audit sheet