Download
1 / 40
410 likes | 617 Views
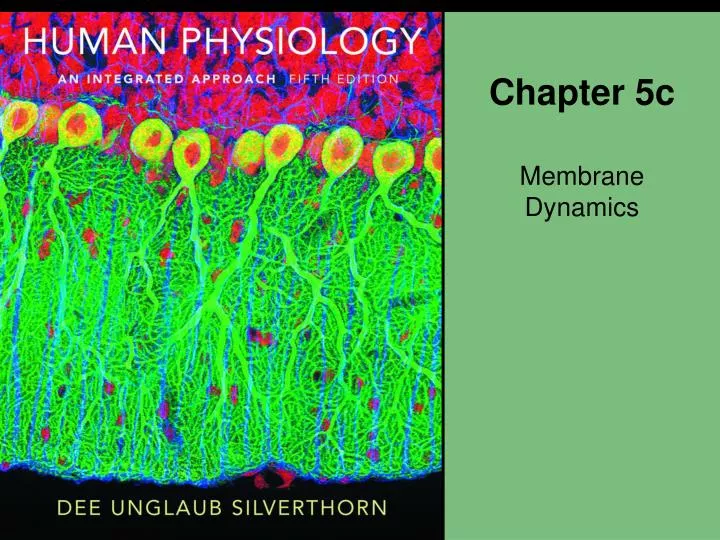
Chapter 5c. Membrane Dynamics. The Body Is Mostly Water. Distribution of water volume in the three body fluid compartments 1 liter water weighs 1 kg or 2.2 lbs 70 kg X 60% = 42 liters for avg 154 lb male. Figure 5-25. Aquaporin.

E N D
Chapter 5c Membrane Dynamics
The Body Is Mostly Water • Distribution of water volume in the three body fluid compartments • 1 liter water weighs 1 kg or 2.2 lbs • 70 kg X 60% = 42 liters for avg 154 lb male Figure 5-25
Aquaporin • Moves freely through cells by special channels of aquaporin
Osmosis and Osmotic Pressure A B Volume increased • Osmolarity describes the number of particles in solution Selectively permeable membrane Volume decreased Glucose molecules 1 2 Two compartments are separated by a membrane that is permeable to water but not glucose. Water moves by osmosis into the more concentrated solution. Volumes equal 3 Osmotic pressure is the pressure that must be applied to B to oppose osmosis. Figure 5-26
Osmolarity: Comparing Solutions Hyper / Hypo / Iso are relative terms Osmolarityis total particles in solution Normal Human body around 280 – 300 mOsM Table 5-5
Tonicity • Solute concentration = tonicity • Tonicity describes the volume change of a cell placed in a solution Table 5-6
Tonicity • Tonicity depends on the relative concentrations of nonpenetrating solutes Figure 5-27a
Tonicity • Tonicity depends on nonpenetrating solutes only Figure 5-27b
Cell H2O Solution (a) (c) (d) (b) Tonicity • Tonicity depends on nonpenetrating solutes only Figure 5-28
Plasmolysis and Crenation • RBC’s
Osmolarity and Tonicity Table 5-7
Intravenous Solutions Table 5-8
Electricity Review • Law of conservation of electrical charges • Opposite charges attract; like charges repel each other • Separating positive charges from negative charges requires energy • Conductor versus insulator
(b) Cell and solution in chemical and electrical disequilbrium. Intracellular fluid Extracellular fluid Separation of Electrical Charges • Resting membrane potential is the electrical gradient between ECF and ICF Figure 5-29b
Separation of Electrical Charges • Resting membrane potential is the electrical gradient between ECF and ICF Figure 5-29c
Measuring Membrane Potential Difference The voltmeter A recording electrode Input Output The ground ( ) or reference electrode Cell Saline bath The chart recorder Figure 5-30
Potassium Equilibrium Potential Artificial cell (a) Figure 5-31a
Potassium Equilibrium Potential K+ leak channel (b) Figure 5-31b
Potassium Equilibrium Potential • Resting membrane potential is due mostly to potassium • K+ can exit due to [ ] gradient, but electrical gradient will pull back; when equal resting membrane potential Concentration gradient Electrical gradient (c) Figure 5-31c
15 mM +60 mV 150 mM 0 mV Sodium Equilibrium Potential • Single ion can be calculated using the Nernst Equation • Eion = 61/z log ([ion] out / [ion] in) Figure 5-32
Resting Membrane Potential Intracellular fluid -70 mV Extracellular fluid 0 mV Figure 5-33
Changes in Membrane Potential • Terminology associated with changes in membrane potential PLAY Interactive Physiology® Animation: Nervous I: The Membrane Potential Figure 5-34
3 2 4 5 1 KATP channels open. Metabolism slows. ATP decreases. Low glucose levels in blood. Cell at resting membrane potential. No insulin is released. K+ leaks out of cell Voltage-gated Ca2+ channel closed Glucose ATP Metabolism GLUT transporter No insulin secretion Insulin in secretory vesicles (a) Beta cell at rest Insulin Secretion and Membrane Transport Processes Figure 5-35a
1 Low glucose levels in blood. Glucose (a) Beta cell at rest Insulin Secretion and Membrane Transport Processes Figure 5-35a, step 1
2 1 Metabolism slows. Low glucose levels in blood. Glucose Metabolism GLUT transporter (a) Beta cell at rest Insulin Secretion and Membrane Transport Processes Figure 5-35a, steps 1–2
3 2 1 Metabolism slows. ATP decreases. Low glucose levels in blood. Glucose ATP Metabolism GLUT transporter (a) Beta cell at rest Insulin Secretion and Membrane Transport Processes Figure 5-35a, steps 1–3
3 2 4 1 KATP channels open. Metabolism slows. ATP decreases. Low glucose levels in blood. K+ leaks out of cell Glucose ATP Metabolism GLUT transporter (a) Beta cell at rest Insulin Secretion and Membrane Transport Processes Figure 5-35a, steps 1–4
3 2 4 5 1 KATP channels open. Metabolism slows. ATP decreases. Low glucose levels in blood. Cell at resting membrane potential. No insulin is released. K+ leaks out of cell Voltage-gated Ca2+ channel closed Glucose ATP Metabolism GLUT transporter No insulin secretion Insulin in secretory vesicles (a) Beta cell at rest Insulin Secretion and Membrane Transport Processes Figure 5-35a, steps 1–5
Insulin Secretion and Membrane Transport Processes 5 2 3 4 1 KATP channels close. Metabolism increases. ATP increases. High glucose levels in blood. Cell depolarizes and calcium channels open. 6 Ca2+ entry acts as an intracellular signal. Ca2+ Glucose Glycolysis and citric acid cycle ATP Ca2+ 7 GLUT transporter Ca2+ signal triggers exocytosis and insulin is secreted. (b) Beta cell secretes insulin Figure 5-35b
Insulin Secretion and Membrane Transport Processes 1 High glucose levels in blood. Glucose (b) Beta cell secretes insulin Figure 5-35b, step 1
Insulin Secretion and Membrane Transport Processes 2 1 Metabolism increases. High glucose levels in blood. Glucose Glycolysis and citric acid cycle GLUT transporter (b) Beta cell secretes insulin Figure 5-35b, steps 1–2
Insulin Secretion and Membrane Transport Processes 2 3 1 Metabolism increases. ATP increases. High glucose levels in blood. Glucose Glycolysis and citric acid cycle ATP GLUT transporter (b) Beta cell secretes insulin Figure 5-35b, steps 1–3
Insulin Secretion and Membrane Transport Processes 2 3 4 1 KATP channels close. Metabolism increases. ATP increases. High glucose levels in blood. Glucose Glycolysis and citric acid cycle ATP GLUT transporter (b) Beta cell secretes insulin Figure 5-35b, steps 1–4
Insulin Secretion and Membrane Transport Processes 5 2 3 4 1 KATP channels close. Metabolism increases. ATP increases. High glucose levels in blood. Cell depolarizes and calcium channels open. Ca2+ Glucose Glycolysis and citric acid cycle ATP GLUT transporter (b) Beta cell secretes insulin Figure 5-35b, steps 1–5
Insulin Secretion and Membrane Transport Processes 5 2 3 4 1 KATP channels close. Metabolism increases. ATP increases. High glucose levels in blood. Cell depolarizes and calcium channels open. 6 Ca2+ entry acts as an intracellular signal. Ca2+ Glucose Glycolysis and citric acid cycle ATP Ca2+ GLUT transporter (b) Beta cell secretes insulin Figure 5-35b, steps 1–6
Insulin Secretion and Membrane Transport Processes 5 2 3 4 1 KATP channels close. Metabolism increases. ATP increases. High glucose levels in blood. Cell depolarizes and calcium channels open. 6 Ca2+ entry acts as an intracellular signal. Ca2+ Glucose Glycolysis and citric acid cycle ATP Ca2+ 7 GLUT transporter Ca2+ signal triggers exocytosis and insulin is secreted. (b) Beta cell secretes insulin Figure 5-35b, steps 1–7
Summary • Mass balance and homeostasis • Law of mass balance • Excretion • Metabolism • Clearance • Chemical disequilibrium • Electrical disequilibrium • Osmotic equilibrium
Summary • Diffusion • Protein-mediated transport • Roles of membrane proteins • Channel proteins • Carrier proteins • Active transport
Summary • Vesicular transport • Phagocytosis • Endocytosis • Exocytosis • Transepithelial transport
Summary • Osmosis and tonicity • Osmolarity • Nonpenetrating solutes • Tonicity • The resting membrane potential • Insulin secretion