Download
1 / 25
250 likes | 335 Views
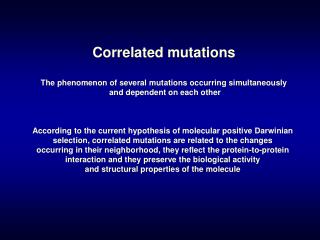
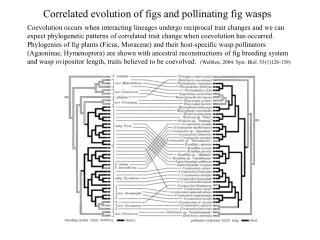
Correlated trait evolution. Maximum likelihood approach (Pagel and Milligan). Procedure. Estimate the set of rates in the q-matrix that maximize the likelihood of the data and calculate that likelihood

E N D
Procedure • Estimate the set of rates in the q-matrix that maximize the likelihood of the data and calculate that likelihood • Constrain the matrix so that it represents independence (q12 = q34; q13 = q24; q21 = q43; q31 = q42) and repeat the calculation • Use a likelihood ratio test to evaluate significance
Fruit color/size in figsLomascolo et al. (2008) OECOLOGIAlikelihood ratio = 4.889; P value = 0.027
Wind-pollination correlated with….? Friedman and Barrett (2008) IJPS
Wind-pollination correlated with….? Friedman and Barrett (2008) IJPS
Issues to consider • Rejection of independence does not tell you what kind of non-independence you have • You need reasonable branch lengths • Sampling matters (if perhaps less than parsimony)
Continuous traits • All morphological traits can be treated as continuous variables • Often people have wanted to look at the correlation of such variables across species
Sperm competition in primates But, species are not independent!
Major Available Methods • Linear/square-change Parsimony • Independent contrasts • Phylogenetic Generalized Least Squares
e f g Linear/Square-change parsimony b c d a Tips = n Branches = 2n-2
Linear Parsimony • Find the set of ancestral states such that the absolute amount of change summed across branches is minimized • Each internal node is the average of the three surrounding nodes
e f g Graph the changes b c d a 10 4 2 6 5 3 5 3 6 Change in y 0 2 4 1 1 -10 -10 0 10 Change in x
e f g Independent contrasts b c d a Tips = n Contrasts = n-1
Independent Contrasts value of x value of y 7 9 14 20 20 24 30 40 22 35 8 17
Independent Contrasts • Calculations: • by convention, contrasts for independent variable are positive • contrasts for dependent variable may be positive or negative • correlate contrasts • no correlation = no causal relationship • significant correlation = causal relationship (negative or positive)
Independent Contrasts value of x value of y 30 40 20 24 20 7 9 14 22 35 8 17 x y d1 2 4 d2 6 10 d3 9 13
Independent Contrasts 10 x y d1 2 4 d2 6 10 d3 9 13 y contrast 0 15 x contrast
Assumptions of independent contrasts • We know branch lengths • We know tip values with certainty • Traits values evolve by Brownian motion • Needed to calculate ancestral states • Needed to accommodate error in the estimation of ancestral states
Assumptions of independent contrasts • We know branch lengths • Traits values evolve by Brownian motion • Strength of correlation is the same across the tree
Broader objections • The tip correlation may be what we care about • No characters evolve by Brownian motion • The assumption of a constant “correlation” is biologically unrealistic