Download
1 / 58
580 likes | 718 Views
Results from the 2005 National Survey on Drug Use and Health (NSDUH). Briefing for DHHS September 5, 2006 Joe Gfroerer, OAS, SAMHSA. Average Annual Percent Changes in Youth Substance Use, by Survey.

E N D
Results from the2005 National Survey on Drug Use and Health (NSDUH) Briefing for DHHS September 5, 2006 Joe Gfroerer, OAS, SAMHSA
Average Annual Percent Changes in Youth Substance Use, by Survey Note: Numbers reflect the percent change occurring each year that would result in the overall change in prevalence from the base year to 2005. PM=Past Month; LT=Lifetime.
NSDUH Design • Representative nationally and in each State • Civilian, noninstitutional population, Age 12+ • Face-to-face interview • Computer-assisted, self-administered • 68,308 respondents in 2005 • Data comparable with 2002, 2003, and 2004, but not with data prior to 2002
Fig 2.2 Illicit Drug Use, Ages 12+: 2002-2005 Percent Using in Past Month + Difference between estimate and the 2005 estimate is statistically significant at the .05 level.
Fig 2.6 Illicit Drug Use, by Age: 2002-2005 Percent Using in Past Month Age in Years + Difference between estimate and the 2005 estimate is statistically significant at the .05 level.
Fig 2.5 Use of Selected Illicit Drugs, Youths Aged 12 to 17: 2002-2005 Percent Using in Past Month + Difference between estimate and the 2005 estimate is statistically significant at the .05 level.
Fig 6.5 Marijuana Use, Ages 12 to 17: 2002-2005 Percent Using Marijuana + Difference between estimate and the 2005 estimate is statistically significant at the .05 level.
Fig 2.9 Marijuana Use by Gender, among Youths Aged 12 to 17: 2002-2005 Percent Using in Past Month + Difference between estimate and the 2005 estimate is statistically significant at the .05 level.
Fig 2.10 Marijuana Use by Geographic Region, Youths Aged 12 to 17: 2002-2005 Percent Using in Past Month + Difference between estimate and the 2005 estimate is statistically significant at the .05 level.
Fig 2.7 Use of Selected Illicit Drugs among Young Adults Aged 18 to 25: 2002-2005 Percent Using in Past Month + Difference between estimate and the 2005 estimate is statistically significant at the .05 level.
Illicit Drug Use among Adults aged 50 to 59, by Type of Drug: 2002-2005 Percent Using in Past Month 4.4 3.8 3.1 2.7+ + Difference between estimate and the 2005 estimate is statistically significant at the .05 level. Difference between 2002 and 2005 for marijuana is statistically significant at .05 level.
Fig 2.3 Past Month Methamphetamine Use and Past Year Illicit Drug or Stimulant Dependence or Abuse, Ages 12+: 2002-2005 Numbers in Thousands + Difference between estimate and the 2005 estimate is statistically significant at the .05 level.
Nonmedical Use of Prescription Drugs, Ages 12+: 2002-2005 Percent Using in Past Month + Difference between estimate and the 2005 estimate is statistically significant at the .05 level.
Nonmedical Use of Prescription Drugs, Youths Aged 12 to 17: 2002-2005 Percent Using in Past Month + Difference between estimate and the 2005 estimate is statistically significant at the .05 level.
Nonmedical Use of Prescription Drugs, Young Adults Aged 18 to 25: 2002-2005 Percent Using in Past Month + Difference between estimate and the 2005 estimate is statistically significant at the .05 level.
Source Where Psychotherapeutics Were Obtained for Most Recent Nonmedical Use among Past Year Users Aged 12 or Older: 2005 Percent of Past Year Users Other Bought on Internet Drug Dealer/ Stranger 1 or More Doctors Bought/Took from Friend/ Relative Free from Friend/Relative 8
Nonmedical Use of Pain Relievers in Past Year among Persons Aged 12 or Older, by Substate Region: Percentages, Annual Averages Based on 2002-2004
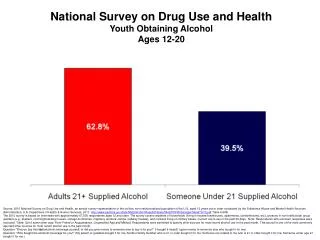
Past Month Alcohol Use • Any Use: 52% (126 million) • Binge Use: 23% (55 million) • Heavy Use: 7% (16 million) (Binge and Heavy Use estimates are similar to those in 2002, 2003, and 2004; Past month use increased from 50% in 2004)
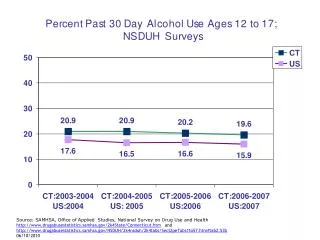
Current Alcohol Use among Persons Aged 12 to 20, by Age: 2002-2005 Percent Using in Past Month + Difference between estimate and the 2005 estimate is statistically significant at the .05 level.
Binge Drinking in the Past Month among Persons Aged 12 to 20, by Age: 2002-2005 Percent Using in Past Month + Difference between estimate and the 2005 estimate is statistically significant at the .05 level. 19
Fig 3.5 Driving Under the Influence of Alcohol, Ages 12+: 2002-2005 Percent Driving Under the Influence in Past Year + Difference between estimate and the 2005 estimate is statistically significant at the .05 level.
Fig 3.6 Driving Under the Influence of Alcohol by Age: 2005 Percent Driving Under the Influence in Past Year Age in Years
Fig 4.1 Tobacco Use, Ages 12+: 2002-2005 Percent Using in Past Month + Difference between estimate and the 2005 estimate is statistically significant at the .05 level.
Fig 4.2 Tobacco Use, Youths Aged 12 to 17: 2002-2005 Percent Using in Past Month + Difference between estimate and the 2005 estimate is statistically significant at the .05 level.
Fig 4.4 Cigarette Use by Gender, Youths Aged 12 to 17: 2002-2005 Percent Using in Past Month + Difference between estimate and the 2005 estimate is statistically significant at the .05 level.
Fig 4.5 Cigarette Use among Women Aged 15 to 44, by Age and Pregnancy Status: 2004-2005 Combined Percent Using in Past Month Age in Years
Percent Using in Past Month Substance Use among Pregnant Women, by Age: 2004-2005 Combined
Fig 5.1 Past Year Initiates for Specific Illicit Drugs, Ages 12+: 2005 Numbers in Thousands Marijuana Inhalants Stimulants Sedatives Heroin Pain Relievers Tranquilizers Cocaine Ecstasy LSD PCP
Fig 5.2 Mean Age at First Use for Specific Illicit Drugs among Past Year Initiates Aged 12 to 49: 2005 Age in Years PainRelievers PCP LSD Stimulants Sedatives Inhalants Marijuana Cocaine Ecstasy Heroin Tranquilizers
Fig 5.3 Past Year Marijuana Initiates among Persons Aged 12 or Older and Mean Age at First Use of Marijuana among Past Year Marijuana Initiates Aged 12 to 49: 2002-2005 Numbers in Millions Age in Years Past Year Initiates Mean Age at First Use1 + Difference between estimate and the 2005 estimate is statistically significant at the .05 level. 1 Mean age at first use estimates are among recent initiates aged 12 to 49.
Fig 5.4 Past Year Methamphetamine Initiates among Persons Aged 12 or Older and Mean Age at First Use of Methamphetamine among Past Year Methamphetamine Initiates Aged 12 to 49: 2002-2005 Numbers in Thousands Age in Years Past Year Initiates Mean Age at First Use1 + Difference between estimate and the 2005 estimate is statistically significant at the .05 level. 1 Mean age at first use estimates are among recent initiates aged 12 to 49.
Fig 5.5 Past Year Cigarette Initiates among Persons Aged 12 or Older, by Age at First Use: 2002-2005 Numbers in Millions 2.28 2.12 1.98+ 1.94+ + Difference between estimate and the 2005 estimate is statistically significant at the .05 level.
Fig 6.2 Perceived Great Risk of Cigarette and Alcohol Use, Ages 12 to 17: 2002-2005 Percent Perceiving Great Risk + Difference between estimate and the 2005 estimate is statistically significant at the .05 level.
Fig 6.4 Perceived Great Risk of Use of Selected Illicit Drugs, Ages 12 to 17: 2002-2005 Percent Perceiving Great Risk Smoke Marijuana Once a Month Smoke Marijuana Once or Twice a Week Use Cocaine Once a Month Try Heroin Once or Twice + Difference between estimate and the 2005 estimate is statistically significant at the .05 level.
Fig 7.1 Numbers in Millions 22.5 22.2 22.0 21.6 3.4 3.3 3.2 3.1 + Difference between estimate and the 2005 estimate is statistically significant at the .05 level. Substance Dependence or Abuse in the Past Year, Ages 12+: 2002-2005
Fig 7.2 Dependence on or Abuse of Illicit Drugs in the Past Year, Ages 12+: 2005 Numbers in Thousands
Fig 7.4 Substance Dependence or Abuse in the Past Year, by Age and Gender: 2005 Percent Dependent or Abusing in Past Year
Need for and Receipt of Specialty Treatment in the Past Year for Illicit Drug or Alcohol Use, Ages 12+: 2005 Numbers in Millions Needing Treatment in Past Year 23.2 19.4 7.6 (17%) (8%) (10%) Note: Percentages in parentheses represent the percentage of persons who received specialty treatment among those who needed treatment.
Fig 7.7 Past Year Perceived Need for and Effort Made to Receive Specialty Treatment among Persons Aged 12+ Needing But Not Receiving Treatment for Illicit Drug or Alcohol Use: 2005 Felt They Needed Treatment and Did Not Make an Effort (865,000) Did Not Feel They Needed Treatment 94.4% 1.4% Felt They Needed Treatment and Did Make an Effort (296,000) 20.9 Million Needing But Not Receiving Treatment for Illicit Drug or Alcohol Use Note: Due to rounding, these percentages do not add to 100 percent.
Fig 7.8 Cost/Insurance Barriers Other Access Barriers Not Ready to Stop Using Stigma Did Not Know Where to Gofor Treatment Did Not Have Time Treatment Would Not Help Percent Reporting Reason Reasons for Not Receiving Substance Use Treatment among Persons Aged 12 or Older Who Needed and Made an Effort to Get Treatment But Did Not Receive Treatment and Felt They Needed Treatment: 2004-2005 Combined
SPD and MDE Measures • SPD measure is changed form last year’s report. We now use the shorter version of the mental health module, used in half of 2004 sample. Thus, we have comparable 2004 (revised) and 2005 estimates, but we can’t compare with 2003 and earlier estimates. • MDE youth and adult estimates should be kept separate due to questionnaire differences. • Mental health treatment estimates for youth and adult should also be kept separate due to questionnaire differences.
Major Depressive Episode Among Adults, by Age: 2004-2005 Percent with MDE in Past Year Age in Years + Difference between estimate and the 2005 estimate is statistically significant at the .05 level.
Fig 8.1 Serious Psychological Distress Among Adults Aged 18+, by Age: 2004-2005 Percent with SPD in Past Year Age in Years + Difference between estimate and the 2005 estimate is statistically significant at the .05 level.