Download
1 / 62
650 likes | 926 Views
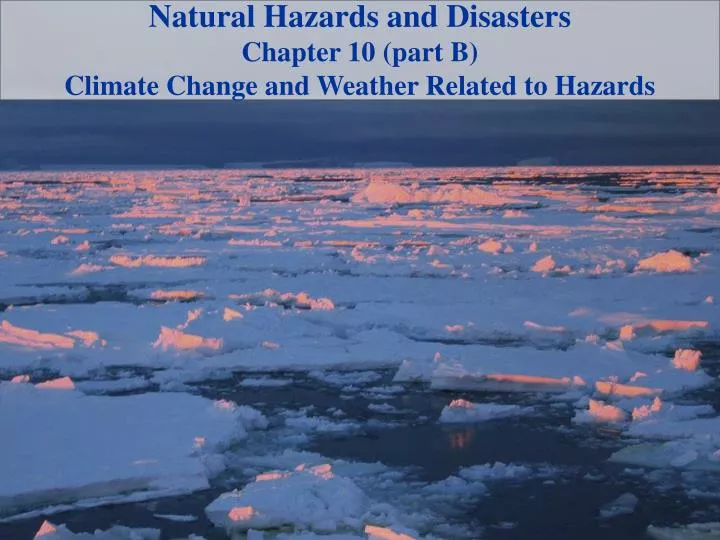
Natural Hazards and Disasters Chapter 10 (part B) Climate Change and Weather Related to Hazards. Hazards Related to Weather and Climate. Many hazards are related to weather Floods Hurricanes and nor’easters Thunderstorms and tornadoes Droughts Heat waves Snow and ice

E N D
Natural Hazards and Disasters Chapter 10 (part B) Climate Change and Weather Related to Hazards
Hazards Related to Weather and Climate • Many hazards are related to weather • Floods • Hurricanes and nor’easters • Thunderstorms and tornadoes • Droughts • Heat waves • Snow and ice • Natural events such as volcanoes can trigger changes in weather patterns that can be hazardous
Drought Prolonged dry climatic event that dramatically lowers available water below that normally used Not abrupt or dramatic, proceeds slowly Involves lower than average precipitation in region Definition varies depending on effect on people Drop in usable water available in reservoirs, in groundwater storage, or in stream flow Timing of precipitation can matter – winter snowpack tends to melt slowly and seep into ground; summer rains tend to run off
Drought • Prolonged drought can lead to migration, social and political upheaval, war • Similar effects as dam-building • Crops weakened by drought are vulnerable to insect attack • Severe drought and disastrous farming practices turned U.S. plains states into ‘Dust Bowl’ in 1930s, coinciding with economic collapse of Great Depression • Drought was widespread across U.S. in 2007 • Appears to correlate with warm phase of AMO
Growing Deserts 1960s through ~ 1980, much of Africa’s Sahel region lost vegetation cover, due to increased population, intensive cultivation in marginal areas, overgrazing Decades of drought fostered desertification Affects about 70% of drylands, 30% of Earth’s surface Tropical hardwood forests on marginal soil are cut rapid runoff, soil loss, severe floods, dust storms that travel around world
Heat Waves Effects of excessive temperature build up slowly but can be deadly Tendency to view hot weather as discomfort or inconvenience rather than health emergency Urban areas have increased stress with ground-level ozone, smog, heat-island effect (as much as 5oC hotter than surrounding countryside) Chicago, 1995: heat wave killed 600-700 people Europe, 2003: more than 35,000 deaths attributed to heat wave
~35,000 Killed, ~15,000 Deaths in France Alone
Snow and Ice • Cold temperatures, snow and ice, and wind can lead to frostbite or hypothermia • Areas downwind of lakes have lake-effect snow, unusually high snowfalls • Amount of snow determined by: • Expanse of ice-free water under storm track (for evaporation) • Duration of strong wind blowing over water (for greater evaporation) • Amount of moisture in atmosphere • Topographic rise downwind of water (to lift moisture and cause condensation)
Snow and Ice As long as cold air keeps blowing across water, snow continues to form and fall downwind Global warming will cause more ice-free water, therefore more lake-effect snow Also can be seen during nor’easter: ocean-effect snow Ice storms depend on humid air and warmer temperatures above cold ground-level air
Atmospheric Cooling • Volcanic eruptions produce large amounts of sulfur dioxide and other aerosols that cool Earth by reflecting sunlight back into outer space • SO2 droplets can remain in atmosphere for years until washed out by rain • 1815 Tambora eruption caused “Year without a Summer” • 1991 Pinatubo eruption very similar
Atmospheric Cooling • Atmosphere can be cooled by anything that puts particulates (soot, ash) in air • Forest fires • Dust blowing off deserts and drought-affected croplands • Industrial smokestacks • Burning wood, coal and peat • Volcanic eruptions that produce large amounts of ash
The Greenhouse Effect • Sunlight is short-wave radiation, passes easily through atmosphere, heats up Earth’s surface • Heat and other long-wave radiation produced at surface then heats up water and gases in atmosphere • Greenhouse effect depends on effectiveness in blocking outgoing long-wave radiation (heat) and abundance in atmosphere • CO2 greatest total effect • Followed by CH4 • N02, fluorinated gases also contribute, but much less • Without some natural greenhouse effect, Earth would be uninhabitable, average temperature below freezing
Global Warming and the Greenhouse Effect • Earth’s average surface temperature has been rising since Industrial Revolution began in late 1700s, increase of about 1°C • Intergovernmental Panel on Climate Change (IPCC) estimated in 2007 that Earth’s average surface temperature will likely rise by 1.6-3.4°C over next century • Compares to 4°C rise since peak of last ice age 20,000 years ago • 1°C equates to 5/9°F
Global Warming and the Greenhouse Effect http://sres.ciesin.org/
The Greenhouse Effect • Vast majority of scientists attribute most of recent rise in atmospheric temperature to increases in atmospheric greenhouse gases • Carbon dioxide (CO2) • Methane (CH4) • Chlorofluorocarbons (CFCs) • Ozone (O3) • Nitrous dioxide (NO2) • Greenhouse gases trap heat in atmosphere by greenhouse effect – allow light to shine through but prevent heat from escaping • No natural source can explain this
Rising Levels of Greenhouse Gases Natural cycles in atmospheric CO2have varied from less than 200 to almost 300 ppm in last 650,000 years Pre-industrial value of 280 ppm skyrocketed to 380 ppm in 2005 Current increase of 2 ppm per year
Rising Levels of Greenhouse Gases • Most CO2 increase is human-caused • Burning of fossil fuels (coal, oil, natural gas) • Land-use changes • By-products of cement production • Some greenhouse gases are absorbed by natural buffers • Plants absorb CO2 • Some CO2 dissolves into ocean water • As water temperatures rise, less CO2 will be absorbed by ocean
Consequences of Climate Change Warming of Earth’s surface brings change to weather patterns, other aspects of climate Greater variability of weather, more extremes of temperature, winds, precipitation Abrupt changes in regional climate (in decade or two) could be disastrous Economic disruption, population migration, political upheaval and conflicts over resources
Warming Oceans Increase in atmospheric temperature has been moderated by oceans, which soak up more than 80% of warming Small warming of oceans contributes significantly to energy that drives storms Water expands as it warms – sea level rise Warmer temperatures will cause more evaporation from oceans increasing atmospheric water vapor increasing global warming
Warming Oceans Warming oceans is trend that cannot easily be reversed Oceans can only be cooled by cooling atmosphere above them Even with no further manmade emissions, it would take hundreds to thousands of years to cool environment to level of century ago
Precipitation Changes • Areas closer to poles, equator will become wetter • Warmer midlatitude regions will get drier • More energy in atmosphere more storms • Hurricanes and tornadoes would be more frequent and stronger • Increased incidence of droughts and floods
Arctic Thaw Surface of Arctic Ocean has been frozen as long as anyone can remember Arctic sea ice has decreased by about 8% per decade since 1970s, for total loss of about 20% Feedback mechanism: high-albedo white ice reflects solar radiation and cools air; darker ocean water absorbs sun’s energy, melting more ice Permafrost is thawing, releasing more carbon, sending more water into rivers and ocean Glaciers also melting, shrinking dramatically
Sea-Level Rise • Global warming leads to sea-level rise two ways: • Water added from melting of ice on land • Heating and expansion of sea water • Melting Arctic sea ice does not contribute to sea-level rise (ice displaces same volume that meltwater would occupy) • Melting all Greenland ice would raise sea level by about 7 m • Melting all Antarctic ice would raise sea level by about 66 m • Complete melting of both ice sheets is not likely in foreseeable future
Sea-Level Rise • Actual sea-level rise between 1870 and 2000 from thermal expansion and glacier melting was about 19 cm, and rate is increasing • Sea-level rise will eventually cause flooding of coastal areas, including largest cities (New York City, Tokyo, Mumbai) • Current rate is about 30 cm per century • Rise of 30-50 cm expected over next century • Low-lying areas would lose significant land area • Many more deaths during strong storms
Global Ocean Circulation: The Thermohaline Circulation • Also called the Meridional Overturning Circulation (MOC) • The Gulf Stream pushes water towards the Arctic • Cooler, denser water sinks, and travels into the deep basins in the Atlantic • As it moves into the Indian and Pacific Oceans, it warms, and returns to the surface • Changes in local salinity (from melting ice) could affect path and strength of major ocean circulation patterns
Global Ocean Circulation • Loss of ocean circulation could result in colder winters in eastern North America and northern Europe • Probably would be offset by global warming • Ocean circulation has shut down in the past • Stopped 12,700 years ago in cold period • Restarted 1,800 years later • Both changes occurred in less than decade
Mitigation of Climate Change • No clear way to stop trend of atmospheric CO2doubling in next century • Severe changes in weather patterns: • Decreased snowpack in Rockies • Rainfall increase in northern Europe • Drier conditions in southern Europe • Warmer northern climates would allow northward migration of insects bearing diseases like malaria and West Nile virus
Mitigation of Climate Change • Policy changes necessary to reduce vulnerability to effects of global warming • Reduce energy generation from burning of fossil fuels • Increase conservation (‘standby’ portion of electric bill almost 20%) • Improve efficiency of power production and use • Regulation of emissions • Carbon taxes and carbon trading • Subsidies and tax credits • Capture and sequestration of greenhouse gases • Use of alternative fuels such as wind, solar collectors (silicon panels, ‘thin-film’, water tubes) possibly nuclear power
The Kyoto Protocol • 111 countries signed Kyoto Protocol in 1997, to reduce emissions of six greenhouse gases beginning in 2008 • Not U.S. or Russia, until Russia signed in 2004 • Treaty then met threshold for activation • U.S. instead plans to reduce rate of increase of greenhouse gas emissions to less than rate of increase in U.S. economic growth
The Kyoto Protocol • U.S. was largest contributor to emissions at that time, but argued that it shouldn’t have to do most, while other, developing nations were held to lower standards • Several states decided to do their part despite federal government’s inaction • California’s cap on greenhouse gas emissions, cut to 1990 levels by 2020 • Supreme Court ruled in 2007 that carbon dioxide is pollutant, EPA must regulate (against federal government’s position)
The Kyoto Protocol • High stakes in changes to global energy policies • Countries that historically contributed most to CO2 (such as U.S.) profited from unrestrained industrial development to become wealthiest in world • Countries now going through rapid industrial development feel they should not be limited by environmental restraints, that industrialized nations should cut emissions first because can afford to do so • Huge populations are too poor to afford efficient fuel for basic needs such as cooking food
The Kyoto Protocol • Without cooperation of large emitters like China and India, bleak prospects for significant emissions reduction • China generates far less greenhouse gases on per capita basis, but overtook U.S. as largest overall emitter in 2006 • Immense population • Rapid development • Minimal pollution controls • Dramatic increase in number of heavily polluting coal-fired power plants • Increase in cement production
The Kyoto Protocol • Average American produces 16 times as much CO2as average Indian, but India is catching up • Only abundant energy source for China and India is coal • Least efficient fuel • Generates most greenhouse gases • Even with most optimistic scenarios: • Total CO2in atmosphere would not level off until after 2060 at level of 475 ppm
Alternative Energy Sources • Energy sources that do not emit CO2: • Nuclear power • Hydroelectric power from falling water • Wind turbines • Solar energy • Geothermal power • Tidal energy
Alternative Energy Sources • Cost of energy drives usage • Coal, natural gas: 5 cents per kilowatt-hour • Coal would be 6.3 cents if hidden costs from health effects of air pollution were included • Wind: 6 cents per kilowatt-hour • Giant turbines are noisy, unsightly, kill birds • Nuclear energy: 6.5 cents per kilowatt-hour • Solar panels: 22 cents per kilowatt-hour
Alternative Energy Sources • Countries with little fossil fuel use more nuclear energy • Limited deposits of uranium fuel (50 more years) • Safety and disposal of nuclear waste • Tidal power systems: pollution-free, expensive to build • Hydrogen fuel generates electric power by burning hydrogen with oxygen • Requires power source to first separate hydrogen from oxygen • Can be generated in centralized plants where CO2can be captured and hopefully sequestered • Add ethanol to gasoline: increases fuel, burns cleaner • Decreases fuel efficiency if take into consideration fertilizer, water and machines needed to make and transport ethanol
Alternative Energy Sources • Potential major source of methane: methane hydrate • Frozen methane-ice compound trapped in seafloor layers • Recovering 1% of methane hydrate would double current methane reserves of U.S. • No technology currently available to tap offshore reserves • Unintended release of methane: • Stability depends on pressure and temperature • Methane is 20 times more potent greenhouse gas than CO2 3% of present methane emissions from ocean floor • Triggers for large release of large amounts of methane: • Major earthquakes, hurricanes, seafloor slumping, drilling activities that initiate landslides
Sequestration of Greenhouse Gases • Remove CO2 from air and pump into underground storage reservoirs • Currently done to repressurize oil fields, extract more oil and gas • Half of new CO2 generated could be confined if all world’s oil fields reinjected CO2 could pump CO2 into former natural gas reservoirs • Could pump liquefied CO2 into deep ocean-floor sediments • Could trigger earthquakes • Could cause acidification of groundwater