Download
1 / 24
240 likes | 267 Views
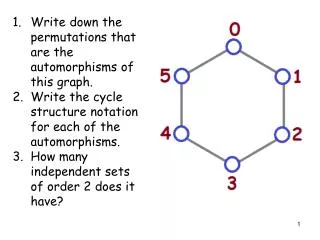
1. Be able to write down the period and amplitude from a graph. 2. Be able to state the period and amplitude from an equation. 3. Be able to write down equation from the trig graph. Sketch trig graphs. trig graphs. The graph of a function which has a repeated pattern is called PERIODIC.

E N D
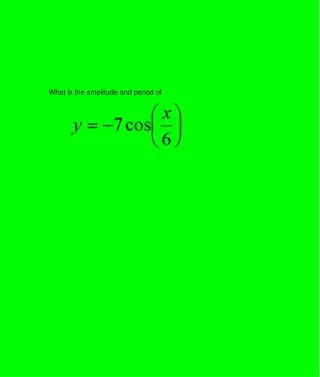
1. Be able to write down the period and amplitude from a graph 2. Be able to state the period and amplitude from an equation 3. Be able to write down equation from the trig graph Sketch trig graphs
trig graphs The graph of a function which has a repeated pattern is called PERIODIC The graph of y = sinx y=cosx and y=tanx repeat themselves and are therefore periodic The period is the number of degrees or radians in each pattern The AMPLITUDE of the periodic graph is half the difference between the max and min values of the function ( the y coordinates)
Features of the graph y =sinx y=sinx Period =360 (90,1) amplitude =1 360 180 (270,-1) Period =360 Amplitude=1 Max value = 1 when x = 90 Min value = -1 when x=270 Graph cuts the x axis when x =0 180 and 360 Annotate graphs put important points on the graph
Features of the cosine graph period y =cosx (0,1) (360,1) Amplitude=1 (90,0) (270,0) (180,-1) Period =360 Amplitude=1 Max value = 1 when x = 0 Min value = -1 when x=180 Graph cuts the x axis when x =90 and270 and Annotate graph
Features of the tangent graph Period =180 asymptotes y =tanx (0,0) (180,0) (360,0) Period =180 Amplitude cannot be measured Max of min values cannot be measured Asymptotes at x =90 and x = 270 Graph cuts the x axis when x =0 ,180 and 360 and Annotate graph
Graphs of the type y = 3sin x y = 3sinx Period =360 (90,3) Amplitude =3 (360,0) (180,0) (0,0) (270,-3) Period = 360 Amplitude = 3 Max value = 3 when x = 90 Min value = -3 when x=270 Graph cuts the x axis when x =0 180 and 360
Graphs of the type y=sin2x y =sin2x (225,1) Period =180 (45,1) amplitude (180,0) (270,0) (90,0) (135,-1) Period = 360/2 =180 Amplitude = 1 Max value = 1 when x = is 90/2 = 45 and 45 + 180 Min value = -1 when x=270/2 =135 and 135 + 180 Graph cuts the x axis when x =0 180/2 and 360/2 0 ,90 and 180 , 270 , 360
Graphs of the type y=3sin2x y = 3sin2x (45,3) (225,3) Amplitude =3 (90,0) (180,0) (270,0) Period =180 (135,-3) (315,-3) Period = 360/2 =180 Amplitude = 3 Max value = 3 when x = is 90/2 = 45 and 45 + 180 Min value = -3 when x=270/2 =135 and 135 + 180 Graph cuts the x axis when x =0 180/2 and 360/2 0 ,90 and 180 , 270 , 360
The general casey = a sinbx and y = acos bx Period = 360/b Amplitude = a Max value = a when x = is 90/b Min value = -a when x=270/b Graph cuts the x axis when x =0 180/b and 360/b The values are repeated every 360 /b degrees Period = 360/b Amplitude = a Max value = a when x = is 0 and 360/b Min value = -a when x=180/b Graph cuts the x axis when x =90/b and 270/b The values are repeated every 360 /b degrees Ex 4A p53 heineman
Graphs of the type y =asinbx +c y=acosbx + c Amplitude = anumber of wavelengths in 360º = b shift along the y axis =cPeriod = 360/b y = asin(x+d) y=acos(x+d) Amplitude = ano. of wavelengths in 360º = 1shift along the x axis = -dPeriod = 360
y =asinbx +c and y = acosbx =c This is like the graph of y = 3sin 2x but there is a shift of 1 up the y axis period amplitude Period = 360/2 =180 Amplitude = 3 = (max – min ) /2 Max value = 4 when x = is 90/2 = 45 and 45 + 180 Min value = -2 when x=270/2 =135 and 135 + 180 to find where the graph cuts the x axis requires trig equations which are yet to be delt with
Y = 3 sin (x + 30 ) Y = 3sin (x +30) is 30 to the left of y = 3 sin x a horizontal shift of 30 to the left a horizontal shift of 30 to the left
Y=3sin(x + 30) Period = 360 Amplitude = 3 Max value = 3 when x = 90-30 = 60 Min value = -3 when x=270 –30 =240 Graph cuts the x axis when x =0-30 , 180-30 and 360-30
Y = 3 sin (x + 30 ) +1 Period =360 amplitude Period = 360 Amplitude = 3 = (5 - 2)/2 = ( max –min)/2 Max value = 4 when x = 90-30 = 60 Min value = -2when x =270 –30 = 240 Graph cuts the x axis will be found from the trig equation 3 sin (x + 30 ) +1 = 0 (later work)
Eg2 for the function y= 3cos 2x + 1 state the period and the amplitude Period = 360 /2 =180 Amplitude = 3
Given the trig graph find the equation y = acos (x - d ) d y = sinbx a y = a cos x + b c Amplitude a No. of wavelengths in 360 b Lift along the y axis c Shift along the x axis d
The graph has an equation in the form y = asin bx or y = acos bx. Write an equation for the graph 2 wavelengths Amplitude = 3 Graph like cos b = 2 a = 3 y = 3 cos 2x Equation
Finding the equation of a trig graph Eg2 The graph has an equation in the form y = asin bx +c or y = acos bx +c . Write an equation for the graph 1 Amplitude =(max-min)/2 Shift =c = max -a Number of wavelengths in 360 is 4 (5-1)/2 = 4/2 =2 b = 4 a = 2 = 5-2 = 3 Graph is like a sin graph Equation is y = 2sin 4x + 3
Ex 4B p54 heineman Ex 3 p50 MIA
Sketching the graphs of trig functions Either use period amplitude and intersects with x and y axes Or use knowledge of transforming graphs learned in unit 1
Sketch and annotate the graph of y = 3 cos 2x-1 Amplitude =3 Period = 360/2 = 180 Max value 3 –1 =2 when x = 0 and 360/2 = 180and 180 + 180 Min values –3 –1 = -4when x = 180/2 = 90 an 90 +180 Add on the period , 180 , to the first angles (180,2) 2 x x x 0 90 180 270 360 -2 -4 x x (270,-4) (90,-4)
Sketch and annotate the graph of y = 3 cos 2x-1 using composition of functions Draw y=cos2x compress (horizontally by a factor2) Start with y=cosx Draw 3cos2x ( stretch vertically by a factor3) Draw y=3cos2x –1 by sliding vertically down by 1 ex4B P54 HEINEMAN EX 3 P 50 MIA
MIA p 51 ex 3 q5, 6 MIA p 51 ex 3 q5, 6