Download
1 / 1
10 likes | 108 Views
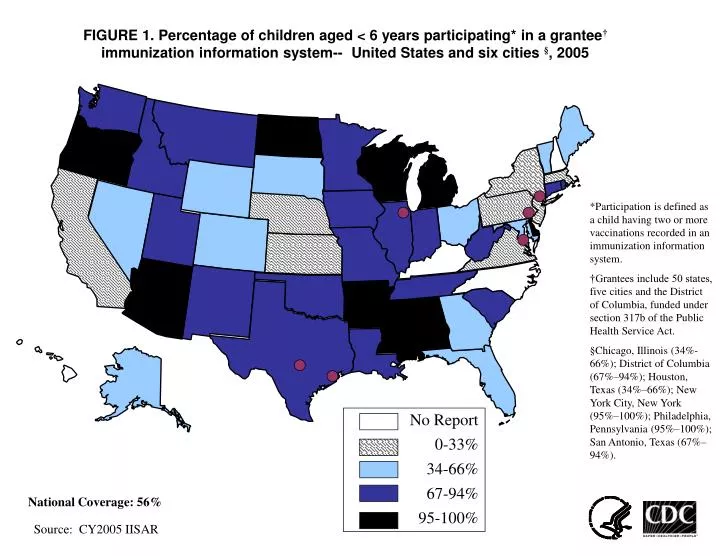
FIGURE 1. Percentage of children aged < 6 years participating* in a grantee † immunization information system-- United States and six cities § , 2005. *Participation is defined as a child having two or more vaccinations recorded in an immunization information system.

E N D
FIGURE 1. Percentage of children aged < 6 years participating* in a grantee†immunization information system-- United States and six cities §, 2005 *Participation is defined as a child having two or more vaccinations recorded in an immunization information system. †Grantees include 50 states, five cities and the District of Columbia, funded under section 317b of the Public Health Service Act. §Chicago, Illinois (34%-66%); District of Columbia (67%–94%); Houston, Texas (34%–66%); New York City, New York (95%–100%); Philadelphia, Pennsylvania (95%–100%); San Antonio, Texas (67%–94%). No Report 0-33% 34-66% 67-94% 95-100% National Coverage: 56% Source: CY2005 IISAR