Download
1 / 18
190 likes | 208 Views
Exploring Lognormal Incomes. Milo Schield Augsburg College Editor: www.StatLit.org US Rep: International Statistical Literacy Project 10 October 2014 National Numeracy Network www.StatLit.org/ pdf/2014-Schield-Explore-LogNormal-Incomes-Slides.pdf

E N D
ExploringLognormal Incomes Milo Schield Augsburg College Editor: www.StatLit.org US Rep: International Statistical Literacy Project 10 October 2014 National Numeracy Network www.StatLit.org/ pdf/2014-Schield-Explore-LogNormal-Incomes-Slides.pdf XLS/Create-LogNormal-Incomes-Excel2013.xlsx
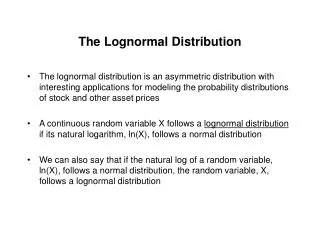
A Log-Normal distribution is generated from a normal with mu = Ln(Median) and sigma = Sqrt[2*Ln(Mean/Median)]. The lognormal is always positive and right-skewed. Examples: Incomes (bottom 97%), assets, size of cities Weight and blood pressure of humans (by gender) Benefit: calculate the share of total income held by the top X% calculate share of total income held by the ‘above-average’ explore effects of change in mean-median ratio. Log-Normal Distributions 2
“In many ways, it [the Log-Normal] has remained the Cinderella of distributions, the interest of writers in the learned journals being curiously sporadic and that of the authors of statistical test-books but faintly aroused.” “We … state our belief that the lognormal is as fundamental a distribution in statistics as is the normal, despite the stigma of the derivative nature of its name.” Aitchison and Brown (1957). P 1. Log-Normal Distributions 3
Use Excel to focus on the model and the results. Excel has two Log-Normal functions: Standard: =LOGNORM.DIST(X, mu, sigma, k) k=0 for PDF; k=1 for CDF. Inverse: =LOGNORM.INV(X, mu, sigma) Use Standard to calculate/graph the PDF and CDF. Use Inverse to find cutoffs: quartiles, to 1%, etc. Use Excel to create graphs that show comparisons. Lognormal and Excel 4
Bibliography 5 .
. Log-Normal Distribution of Units 6
For anything that is distributed by X, there are always two distributions: Distribution of subjects by X Distribution of total X by X. Sometime we ignore the 2nd: height or weight. Sometimes we care about the 2nd: income or assets. Surprise: If the 1st is lognormal, so is the 2nd. Paired Distributions 7
Suppose the distribution of households by income is log-normal with normal parameters mu# and sigma#. Then the distribution of total income by amount has a log-normal distribution with these parameters: mu$ = mu# + sigma#^2; sigma$ = sigma#. See Aitchison and Brown (1963) p. 158.Special thanks to Mohammod Irfan (Denver University) for his help on this topic. Distribution of Households and Total Income by Income 8
. Distribution of Total Income 9
. Lorenz Curve and Gini Coefficient 11
The Gini coefficient is determined by theMean#/Median# ratio. The bigger this ratiothe bigger the Ginicoefficient and thegreater the economicinequality. Champagne-GlassDistribution 12
If the average household income is located at the Xth percentile, then it follows that; X% of all HH have incomes below the average income(1-X)% of all HH are located above this point X% of all HH income is earned by Households above this point. Above-average income households earn X/(1-X) times their pro-rata share of total income Below-average income households earn (1-X)/X times their pro-rata share of income. Balance Theorem 13
Log-normal distribution. Median HH income: $50K. As Mean-Median Ratio Rich get Richer (relatively) 14
. Minimum Income versus Mean Income 15
US Median Income (Table 691*) $46,089 in 1970; $50,303 in 2008 Share of Total Income by Top 5% (Table 693*) 16.6% in 1970; 21.5% in 2008 Best log-normal fits: 1970 Median 46K, Mean 53K: Ratio = 1.15 2008 Median 50K, Mean 73K; Ratio = 1.46 * 2011 US Statistical Abstract (2008 dollars). Which parameters best model US household incomes? 16
Conclusion Using the LogNormal distributions provides a principled way students can explore a plausible distribution of incomes. Allows students to explore the difference between part and whole when using percentage grammar.
Bibliography Aitchison J and JAC Brown (1957). The Log-normal Distribution. Cambridge (UK): Cambridge University Press. Searchable copy at Google Books: http://books.google.com/books?id=Kus8AAAAIAAJ Cobham, Alex and Andy Sumner (2014). Is inequality all about the tails?: The Palma measure of income inequality. Significance. Volume 11 Issue 1. www.significancemagazine.org/details/magazine/5871201/Is-inequality-all-about-the-tails-The-Palma-measure-of-income-inequality.html Limpert, E., W.A. Stahel and M. Abbt (2001). Log-normal Distributions across the Sciences: Keys and Clues. Bioscience 51, No 5, May 2001, 342-352. Copy at http://stat.ethz.ch/~stahel/lognormal/bioscience.pdf Schield, Milo (2013) Creating a Log-Normal Distribution using Excel 2013.www.statlit.org/pdf/Create-LogNormal-Excel2013-Demo-6up.pdf Stahel, Werner (2014). Website: http://stat.ethz.ch/~stahel Univ. Denver (2014). Using the LogNormal Distribution. Copy at http://www.du.edu/ifs/help/understand/economy/poverty/lognormal.html Wikipedia. LogNormal Distribution.