Download
1 / 26
260 likes | 445 Views
Chapter 16 National income, expenditure and product. Y. $. E. P. Gross Domestic Product. Gross Domestic Product (GDP) = the market value of all final goods and services produced in the economy in a given period (e.g. 1 year)

E N D
Gross Domestic Product • Gross Domestic Product (GDP) = the market value of all final goods and services produced in the economy in a given period (e.g. 1 year) • No double counting. The market value of a final good includes the value added at each stage of production • GDP is a measure of productive activity; it excludes: • Second-hand goods • Shares and bonds trading • Transfer payments (e.g. social security payments )
Nominal and Real GDP • Nominal (money) GDP = GDP at current prices • Australia’s GDP in 1997: $529.2 billion • Real GDP = GDP at constant prices (adjusted for inflation) • Annual % change in real GDP = economic growth
Australia’s Nominal and Real GDP Growth, 1991 to 2003, % p.a. 9.0 8.0 7.0 6.0 5.0 4.0 Real GDP % p.a. Nominal GDP 3.0 2.0 1.0 0.0 Source: Adapted from OECD, Economic Outlook, July 2004. 1992 1994 1996 1998 2000 2002 1990 –1.0 –2.0
Measures of GDP • Three different methods of measuring GDP • GDP(I) = income approach • GDP(E) = expenditure approach • GDP(P) = production approach • Statistical identity: Y = E = P • GDP(A) = average of the three measures
Value Added • Market value of the final product, $2, equals the sum of the values added at each stage of the production process • Value added is the value of a firm’s production less the cost of any intermediate goods or services used in production Sum of Value Added = Final Sales Price
GDP Calculation • GDP excludes non-productive transactions: • Non-market items such as the activities of charities and homemakers are excluded • GDP also excludes: • Purely financial transactions • Buying and selling shares • Second-hand sales • Public transfer payments (social security payments)
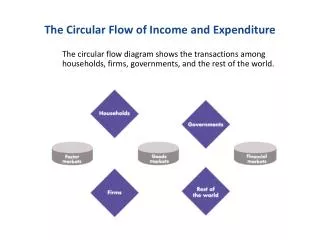
The amount spent on this year’s output e.g. Consumption expenditure by households, plus Government purchases of goods and services, plus Investment expenditure by businesses, plus Net export expenditures Income derived from the production of this year’s output e.g. Wages plus Rents plus Interest plus Profits plus Non-income charges or allocations Two Sides to GDP: Expenditure and Income
GDP May Be Expressed As • Output: GDP(O) • Expenditure: GDP(E) • Income: GDP(I) • Average of these three: GDP(A)
Aggregate Demand/GDP(E) • GDP(E) = aggregate demand (AD) = total expenditures on final goods and services = C + I + G + (X –M) • Main components: • Private final consumption (C) = expenditure on consumer goods and services • Private investment (I) = spending on capital goods • Government spending (G) = spending on final goods and services by government • Net exports (X – M) = expenditure by foreigners on our output as well as by our own citizens on foreign items
Personal Consumption Expenditures (C) • Expenditures by households on • Durable consumer goods (e.g. cars, refrigerators, videos) • Non-durable consumer goods (bread, milk, beer) • Services (banking, legal, car repairs) • ‘C’includes expenditure on imported as well as Australian-produced goods and services (about 60% of total aggregate demand)
Determinants of Personal Consumption (C) • Disposable income • Consumer wealth (e.g. stocks, bonds, real estate) • Consumer expectations/economic circumstances • Credit conditions (interest rates, money supply) • Taxes (e.g. income tax, indirect taxes) • Marketing
Private Investment (I) • Most volatile component (12–19%). Includes • All final purchases of machinery, equipment and tools by business enterprises • All building and construction • Changes in stocks (or inventories) • Main influences • Rates of taxation and government incentives • Cost and availability of credit • Business confidence/profit expectations • Degree of excess capacity
Government Spending (G) • Represents about 20–25 % of GDP(E) • It excludes all government transfer payments (unemployment benefits etc.) • G1 = Current expenditure by the government sector required for the day-to-day operation of government (e.g. wages and salaries of government employees, materials and power) • G2 = Expenditure on capital goods and services by the government sector (e.g. schools, hospitals, transport and telecommunications) (cont.)
Government Spending (G) (cont.) • Main influences • The state of the economy • Ability to provide funds (e.g. from taxes or borrowings) • Political and economic considerations
Net exports (X –M) • Spending by foreigners on Australian goods and services, and • A portion of the totals of C, I and G is for goods and services that have been imported—that is, produced overseas • The total value of imports (M) must be estimated and subtracted from C + I + G + X to avoid an overstatement of total production in Australia
Influences on Net Exports • The world economy (GDP growth in major economies). Exports are to increase in line with GDP growth (and imports) in major partner countries • Cost competitiveness • Labour productivity and capital efficiency • Exchange rates (e.g. a strong Australian dollar will encourage M and discourage X) • Government’s external policies
Australia’s GDP(E), 2001–02, A$ Billion and % of Total Source: Adapted from ABS, Year Book Australia, 2004, p. 771.
International GDP Comparisons($US Billion) • World Bank Atlas method = conversion of GDP in national currency to US$ using the 3-year average annual exchange rate • Example • Australia’s GDP: A$401.4 billion • Average annual exchange rate: A$1 = US$0.7031 • GDP = A$401.4 x 0.7031 = US$282.2 billion
The World’s Largest Economies (GDP in 2003 US$ Billion), World Atlas Method Source: Adapted from World Bank, World Development Indicators, 2004, http://www.worldbank.org.
Structure of Aggregate Demand in Asia Pacific, 2001, % (World Bank) Source: Adapted from the World Bank, World Development Indicators, 2003, Table 4.9.
Related National Income Concepts • Gross National Expenditure (GNE) = C + I + G • Total domestic demand on goods and services. No exports • National Income (NI) = income received by a country’s residents = GDP – (net income paid overseas + depreciation allowances)
The Business Cycle % change Real GDP Expansion Time Peak Contraction Trough Trough
Consumption and Saving • In terms of absolute size, C is the main component of total spending (AD) with about 62% in 1996–97 • Personal saving = that part of disposable income (DI) that is not consumed • Average propensity to consume (APC) = the fraction or percentage of total disposable income that is consumed • Average propensity to save (APS) = the fraction or proportion of total DI that is saved • APC + APS = 1
The Multiplier • The multiplier =the ratio of the income shift brought about by a change in (investment) spending (See text Figures 16.4 and 16.5, p. 296) • Example • An income increase of $100 results in an $80 increase in consumption • MPC = 80/100= 0.8 (cont.)
The Multiplier (cont.) • Therefore, MPS = 20/100 = 0.2 • The multiplier (M) is the no. of times by which changes in GDP exceed the initial change in aggregate spending, brought about by changes in income


![[16 th Ed.] National Income Accounting](https://cdn2.slideserve.com/4427362/16-th-ed-national-income-accounting-dt.jpg)