Download
1 / 67
670 likes | 674 Views
Learn the essential concepts of one-dimensional motion and metric conversions in physics. Master the fundamental principles and equations needed for solving problems.

E N D
<?xml version="1.0"?><AllQuestions /> <?xml version="1.0"?><Settings><answerBulletFormat>Numeric</answerBulletFormat><answerNowAutoInsert>No</answerNowAutoInsert><answerNowStyle>Explosion</answerNowStyle><answerNowText>Answer Now</answerNowText><chartColors>Use PowerPoint Color Scheme</chartColors><chartType>Horizontal</chartType><correctAnswerIndicator>Checkmark</correctAnswerIndicator><countdownAutoInsert>No</countdownAutoInsert><countdownSeconds>10</countdownSeconds><countdownSound>TicToc.wav</countdownSound><countdownStyle>Box</countdownStyle><gridAutoInsert>No</gridAutoInsert><gridFillStyle>Answered</gridFillStyle><gridFillColor>0,0,0</gridFillColor><gridOpacity>100%</gridOpacity><gridTextStyle>Keypad #</gridTextStyle><inputSource>Response Devices</inputSource><multipleResponseDivisor># of Responses</multipleResponseDivisor><participantsLeaderBoard>5</participantsLeaderBoard><percentageDecimalPlaces>0</percentageDecimalPlaces><responseCounterAutoInsert>No</responseCounterAutoInsert><responseCounterStyle>Oval</responseCounterStyle><responseCounterDisplayValue># of Votes Received</responseCounterDisplayValue><insertObjectUsingColor>Blue</insertObjectUsingColor><showResults>Yes</showResults><teamColors>User Defined</teamColors><teamIdentificationType>None</teamIdentificationType><teamScoringType>Voting pads only</teamScoringType><teamScoringDecimalPlaces>1</teamScoringDecimalPlaces><teamIdentificationItem></teamIdentificationItem><teamsLeaderBoard>5</teamsLeaderBoard><teamName1></teamName1><teamName2></teamName2><teamName3></teamName3><teamName4></teamName4><teamName5></teamName5><teamName6></teamName6><teamName7></teamName7><teamName8></teamName8><teamName9></teamName9><teamName10></teamName10><showControlBar>Slides with Get Feedback Objects</showControlBar><defaultCorrectPointValue>100</defaultCorrectPointValue><defaultIncorrectPointValue>0</defaultIncorrectPointValue><chartColor1>187,224,227</chartColor1><chartColor2>51,51,153</chartColor2><chartColor3>0,153,153</chartColor3><chartColor4>153,204,0</chartColor4><chartColor5>128,128,128</chartColor5><chartColor6>0,0,0</chartColor6><chartColor7>0,102,204</chartColor7><chartColor8>204,204,255</chartColor8><chartColor9>255,0,0</chartColor9><chartColor10>255,255,0</chartColor10><teamColor1>187,224,227</teamColor1><teamColor2>51,51,153</teamColor2><teamColor3>0,153,153</teamColor3><teamColor4>153,204,0</teamColor4><teamColor5>128,128,128</teamColor5><teamColor6>0,0,0</teamColor6><teamColor7>0,102,204</teamColor7><teamColor8>204,204,255</teamColor8><teamColor9>255,0,0</teamColor9><teamColor10>255,255,0</teamColor10><displayAnswerImagesDuringVote>Yes</displayAnswerImagesDuringVote><displayAnswerImagesWithResponses>Yes</displayAnswerImagesWithResponses><displayAnswerTextDuringVote>Yes</displayAnswerTextDuringVote><displayAnswerTextWithResponses>Yes</displayAnswerTextWithResponses><questionSlideID></questionSlideID><controlBarState>Expanded</controlBarState><isGridColorKnownColor>True</isGridColorKnownColor><gridColorName>Yellow</gridColorName><AutoRec></AutoRec><AutoRecTimeIntrvl></AutoRecTimeIntrvl><chartVotesView>Percentage</chartVotesView><chartLabelsColor>0,0,0</chartLabelsColor><isChartLabelColorKnownColor>True</isChartLabelColorKnownColor><chartLabelColorName>Black</chartLabelColorName><chartXAxisLabelType>Full Text</chartXAxisLabelType></Settings> <?xml version="1.0"?><AllAnswers /> One Dimensional Motion Physics I
<?xml version="1.0"?><AllQuestions /> <?xml version="1.0"?><Settings><answerBulletFormat>Numeric</answerBulletFormat><answerNowAutoInsert>No</answerNowAutoInsert><answerNowStyle>Explosion</answerNowStyle><answerNowText>Answer Now</answerNowText><chartColors>Use PowerPoint Color Scheme</chartColors><chartType>Horizontal</chartType><correctAnswerIndicator>Checkmark</correctAnswerIndicator><countdownAutoInsert>No</countdownAutoInsert><countdownSeconds>10</countdownSeconds><countdownSound>TicToc.wav</countdownSound><countdownStyle>Box</countdownStyle><gridAutoInsert>No</gridAutoInsert><gridFillStyle>Answered</gridFillStyle><gridFillColor>0,0,0</gridFillColor><gridOpacity>100%</gridOpacity><gridTextStyle>Keypad #</gridTextStyle><inputSource>Response Devices</inputSource><multipleResponseDivisor># of Responses</multipleResponseDivisor><participantsLeaderBoard>5</participantsLeaderBoard><percentageDecimalPlaces>0</percentageDecimalPlaces><responseCounterAutoInsert>No</responseCounterAutoInsert><responseCounterStyle>Oval</responseCounterStyle><responseCounterDisplayValue># of Votes Received</responseCounterDisplayValue><insertObjectUsingColor>Blue</insertObjectUsingColor><showResults>Yes</showResults><teamColors>User Defined</teamColors><teamIdentificationType>None</teamIdentificationType><teamScoringType>Voting pads only</teamScoringType><teamScoringDecimalPlaces>1</teamScoringDecimalPlaces><teamIdentificationItem></teamIdentificationItem><teamsLeaderBoard>5</teamsLeaderBoard><teamName1></teamName1><teamName2></teamName2><teamName3></teamName3><teamName4></teamName4><teamName5></teamName5><teamName6></teamName6><teamName7></teamName7><teamName8></teamName8><teamName9></teamName9><teamName10></teamName10><showControlBar>Slides with Get Feedback Objects</showControlBar><defaultCorrectPointValue>100</defaultCorrectPointValue><defaultIncorrectPointValue>0</defaultIncorrectPointValue><chartColor1>187,224,227</chartColor1><chartColor2>51,51,153</chartColor2><chartColor3>0,153,153</chartColor3><chartColor4>153,204,0</chartColor4><chartColor5>128,128,128</chartColor5><chartColor6>0,0,0</chartColor6><chartColor7>0,102,204</chartColor7><chartColor8>204,204,255</chartColor8><chartColor9>255,0,0</chartColor9><chartColor10>255,255,0</chartColor10><teamColor1>187,224,227</teamColor1><teamColor2>51,51,153</teamColor2><teamColor3>0,153,153</teamColor3><teamColor4>153,204,0</teamColor4><teamColor5>128,128,128</teamColor5><teamColor6>0,0,0</teamColor6><teamColor7>0,102,204</teamColor7><teamColor8>204,204,255</teamColor8><teamColor9>255,0,0</teamColor9><teamColor10>255,255,0</teamColor10><displayAnswerImagesDuringVote>Yes</displayAnswerImagesDuringVote><displayAnswerImagesWithResponses>Yes</displayAnswerImagesWithResponses><displayAnswerTextDuringVote>Yes</displayAnswerTextDuringVote><displayAnswerTextWithResponses>Yes</displayAnswerTextWithResponses><questionSlideID></questionSlideID><controlBarState>Expanded</controlBarState><isGridColorKnownColor>True</isGridColorKnownColor><gridColorName>Yellow</gridColorName><AutoRec></AutoRec><AutoRecTimeIntrvl></AutoRecTimeIntrvl><chartVotesView>Percentage</chartVotesView><chartLabelsColor>0,0,0</chartLabelsColor><isChartLabelColorKnownColor>True</isChartLabelColorKnownColor><chartLabelColorName>Black</chartLabelColorName><chartXAxisLabelType>Full Text</chartXAxisLabelType></Settings> <?xml version="1.0"?><AllAnswers /> Speedand Velocity MHS Physics
Magnitude • Size
Scalar – Quantity with magnitude only Vector – Quantity with magnitude and direction
Distance Displacement or change in position Distance vs. Displacement Final position, x Initial position, xo (x-xo=x) Displacement can be negative! Cutnell & Johnson
D 8 m,E x = +8 12 m,W Distance and Displacement • For motion along x or y axis, the displacement is determined by the x or y coordinate of its final position. Example: Consider a car that travels 8 m, E then 12 m, W. Net displacement D is from the origin to the final position: x D = 4 m, W What is the distance traveled? 20 m !! Author: Tippens, P. (2007)
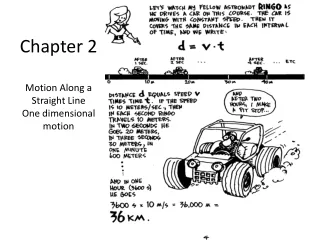
d t 20 m 4 s B d = 20 m s = = A Time t = 4 s Definition of Speed • Speedis the distance traveled per unit of time (a scalar quantity). v = 5 m/s Not direction dependent! Author: Tippens, P. (2007)
B d = 20 m x=12 m A Time t = 4 s Definition of Velocity • Velocityis the displacement per unit of time. (A vector quantity.) North v = 3 m/s East East Direction required! Author: Tippens, P. (2007)
Constant Speed Ticker Tape Diagrams: Which diagram represents a faster constant speed?
Average velocity Average Speed = Means change in, so subtract! What is the difference in the car’s average velocity in part a) and part b)? t = 4.740 s Cutnell & Johnson
s2 = 300 m s1 = 200 m Avg. speed 8.33 m/s Example 1.A runner runs 200 m, east, then changes direction and runs 300 m, west. If the entire trip takes 60 s, what is the average speed and what is the average velocity? Recall that average speed is a function only of totaldistance and total time: start Total distance: s = 200 m + 300 m = 500 m Author: Tippens, P. (2007)
t = 60 s xf= -100 m x1= +200 m xo = 0 Average velocity: Example 1 (Cont.)Now we find the average velocity, which is the net displacement divided by time. In this case, the direction matters. x0 = 0 m; xf = -100 m Direction of final displacement is to the left as shown. Note: Average velocity is directed to the west. Author: Tippens, P. (2007)
14 s A 625 m B 356 m 142 s Example 2.A sky diver jumps and falls for 625 m in 14 s. After chute opens, he falls another 356 m in 142 s. What is average speed for entire fall? Total distance/ total time: Average speed is a function only of total distance traveled and the total time required. Author: Tippens, P. (2007)
From a Graphical View: When finding the average velocity for each interval, what feature of the graph are you calculating? (Math term) Cutnell & Johnson Average velocity Average Speed =
Interpret the motion of the object in the graph below. • How fast (average velocity) is the object traveling in each interval of time? How can this be determined? • What is the average velocity of the entire trip? • What is the average speed of the entire trip?
Warm-up + Notice the correlation between the signs of the slopes and the direction it is traveling in each time interval - + - + During which time intervals did it travel in a positive direction? During which time interval did it travel in a negative direction? 0-10 sec, 40-55 sec 15-40 sec
s = 20 m B C A Time t = 4 s Average Speed and Instantaneous Velocity • The average speed depends ONLY on the distance traveled and the time required. The instantaneous velocity is the magnitude and direction of the speed at a particular instant. (v at point C) Author: Tippens, P. (2007)
Velocity vs. time graph m/s2 Positive Velocity indicates positive displacement 5 s 1 2 3 4 -3 What direction (pos. or neg.) is the object traveling during 0-1 sec? When is the object traveling in a neg. direction? What is the object doing during the 1-2 second interval? What is the average speed from 2-3 seconds? What is the instantaneous speed at 3.5 seconds?
Average Acceleration The rate of change in instantaneous velocity, either magnitude, direction, or both. Acceleration can be either be positive or negative – vector quantity
Graph Relations What type of relationship exists between the position or displacement and time during constant acceleration
Graph Relations How is instantaneous velocity determined from a curve graph?
Graph Relations What does the slope of velocity determined from a curved graph?
Practice What is the instantaneous speed of the object at point B? • 0 • -2 m/s • +2 m/s • -1.3 m/s • +1.3 m/s 0
Interpret the graph below and draw a position vs. time graph and an accel. vs. time graph. Practice +a -a 0 50 +a 75 50 50 25 -50 -a When is the object accelerating? How can this be determined?
Summary: Corresponding Shapes of Motion Graphs with Constant Acceleration d v d v d v d v
Determine displacement from a velocity vs. time graph How do I determine displacement from a velocity vs. time graph? When is it negative?
Velocity vs. Time Graphs G A H F B C E D 1. When was he traveling in a positive direction?2. When was he traveling in a negative direction?3. When was he at rest?4. During what time intervals did he travel at a constant velocity?5.During what time interval did he travel the greatest distance? 6. When does he have a positive acceleration? 7. When is he increasing his speed? Decreasing his speed? 8. What is the average acceleration during interval A? 9. What is the instantaneous acceleration at 2.5 seconds?
Accleration • Constant speed • Acceleration Acceleration is a vector quantity and can be positive or negative How does the distance between dots change as an object acceleration?
Three Ways to Accelerate Hewitt, P. Conceptual Physics.
Motion Equations What does each of the variables represent in the motion equations?
A car starts from rest with an acceleration of 2m/s2. What is its velocity after it has traveled 200m?
Sample Problems • Space to work A car starts from rest and reaches a velocity of 40m/s in 10s. What is its acceleration?
A car travels 300m East, then 100m West, and finally 300mW in 1hour. What is the average speed? What is the average velocity?
YOUR TURN! A ball starts with an initial speed of 2m/s. It accelerates at 0.5m/s2 in a time of 5 seconds. How far did it travel?
YOUR TURN!!! How long will it take to bring the car to a stop from an initial velocity of 10m/s with a deceleration of 2m/s2
+ v1= +8 m/s Example 3 (No change in direction): A constant force changes the speed of a car from 8 m/s to 20 m/s in 4 s. What is average acceleration? t = 4 s v2= +20 m/s Step 1. Draw a rough sketch. Step 2. Choose a positive direction (right). Step 3. Label given info with + and - signs. Author: Tippens, P. (2007)
+ t = 4 s v2 = +20 m/s v1= +8 m/s Step 4. Recall definition of average acceleration. Example 3 (Continued): What is average acceleration of car? 2 Author: Tippens, P. (2007)
+ Example 4:A wagon moving east at 20 m/s encounters a very strong head-wind, causing it to change directions. After 5 s, it is traveling west at 5 m/s. What is the average acceleration?(Be careful of signs.) vf= -5 m/s vo= +20 m/s Step 1. Draw a rough sketch. Step 2. Choose the eastward direction as positive. Step 3. Label given info with + and - signs. Author: Tippens, P. (2007)
Example 4 (Cont.):Wagon moving east at 20 m/s encounters a head-wind, causing it to change directions. Five seconds later, it is traveling west at 5 m/s. What is the average acceleration? Choose the eastward direction as positive. Initial velocity, vo=+20 m/s, east (+) Final velocity, vf = -5 m/s, west (-) The change in velocity, Dv = vf - v0 Dv = (-5 m/s) - (+20 m/s) = -25 m/s Author: Tippens, P. (2007)
Dv Dt vf - vo tf - to aavg = = vo= +20 m/s vf= -5 m/s + Dv = (-5 m/s) - (+20 m/s) = -25 m/s East -25 m/s 5 s a = Example 4: (Continued) a = - 5 m/s2 Author: Tippens, P. (2007)
A student walks 3 meters, North and then 4 meters, South in 6 seconds. What is the average velocity? • 1.167 m/s, North • 1.167 m/s, South • 0.167 m/s, North • 0.167 m/s, South 0
The sign of the velocity of an object represents the • The magnitude • The direction • The acceleration • The speed 0
Describe the motion of the object. Initial position is 0.0 m. 5.0