Download
1 / 18
180 likes | 185 Views
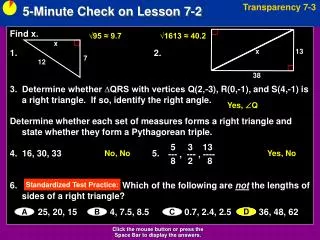
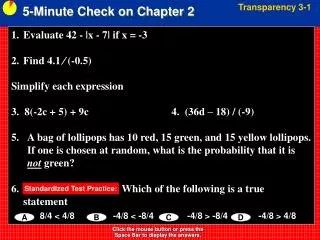
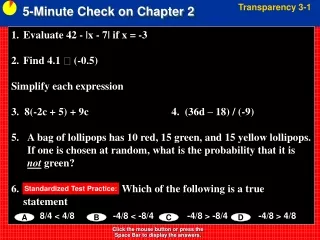
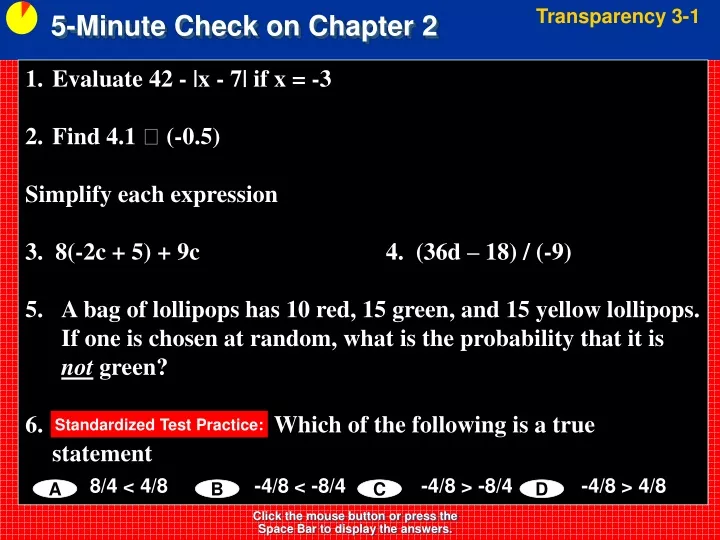
Transparency 3-1. 5-Minute Check on Chapter 2. Evaluate 42 - |x - 7| if x = -3 Find 4.1 (-0.5) Simplify each expression 3. 8(-2c + 5) + 9c 4. (36d – 18) / (-9)

E N D
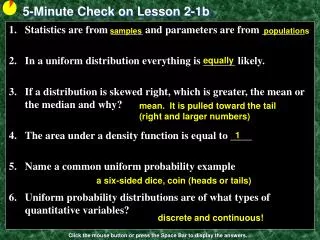
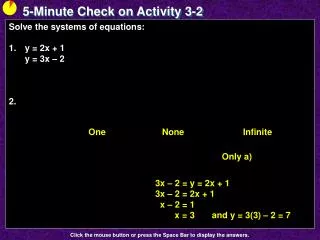
Transparency 3-1 5-Minute Check on Chapter 2 • Evaluate 42 - |x - 7| if x = -3 • Find 4.1 (-0.5) • Simplify each expression • 3. 8(-2c + 5) + 9c 4. (36d – 18) / (-9) • A bag of lollipops has 10 red, 15 green, and 15 yellow lollipops. If one is chosen at random, what is the probability that it is notgreen? • Which of the following is a true statement Standardized Test Practice: 8/4 < 4/8 -4/8 < -8/4 -4/8 > -8/4 -4/8 > 4/8 A B C D Click the mouse button or press the Space Bar to display the answers.
Lesson 10-5 Exponential Functions
Transparency 5 Click the mouse button or press the Space Bar to display the answers.
Objectives • Graph exponential functions • Identify data that displays exponential behavior
Vocabulary • Exponential function –
Key Concept • xxxx
Graph State the y-intercept. x 3x y –1 3–1 0 30 1 1 31 3 2 32 9 Example 1a Graph the ordered pairs and connect the points with a smooth curve. Answer: The y-intercept is 1.
Use the graph to determine the approximate value of The graph represents all real values of x and their corresponding values of y for Answer: The value of y is about 5 when Example 1b Use a calculator to confirm this value.
Graph State the y-intercept. x y –1 4 0 1 1 Example 2a Graph the ordered pairs and connect the points with a smooth curve. Answer: The y-intercept is 1.
Use the graph to determine the approximate value of Answer: The value of y is about 8 when Example 2b Use a calculator to confirm this value.
Depreciation People joke that the value of a new car decreasesas soon as it is driven off the dealer’s lot. The function modelsthe depreciation of the value of a new car that originally cost $25,000. V represents thevalue of the car and t represents the time in years from the time thecar was purchased. Graph the function. What values of V and t are meaningful in thefunction. Answer: Example 3 Use a graphing calculator to graph the function. Only the values of V 25,000 and t 0 are meaningful in the context of the problem.
Original equation Original equation Use a calculator. Use a calculator. Example 3 cont B. What is the value of the car after one year? Answer: After one year, the car’s value is about $20,500. C. What is the value of the car after five years? Answer: After five years, the car’s value is about $9270.
Example 4a Determine whether the set of data displays exponential behavior. Method 1 Look for a Pattern The domain values are at regular intervals of 10. Look for a common factor among the range values. 10 25 62.5 156.25 Answer: Since the domain values are at regular intervals and the range values have a common factor, the data are probably exponential. The equation for the data may involve (2.5)x.
Example 4a cont Method 2 Graph the Data Answer: The graph shows a rapidly increasing value of y as x increases. This is a characteristic of exponential behavior.
Example 4b Determine whether the set of data displays exponential behavior. Method 1 Look for a Pattern The domain values are at regular intervals of 10. The range values have a common difference of 15. 10 25 40 55 +15 +15 +15 Answer: Since the domain values are at regular intervals and there is a common difference of 15, the data display linear behavior.
Example 4b cont Method 2 Graph the Data Answer: The graph is a line, not an exponential function.
Summary & Homework • Summary: • An exponential function is a function that can be described by the equation of the form y = ax, where a > 0 and a ≠ 1 • Homework: • pg