Download
1 / 49
490 likes | 674 Views
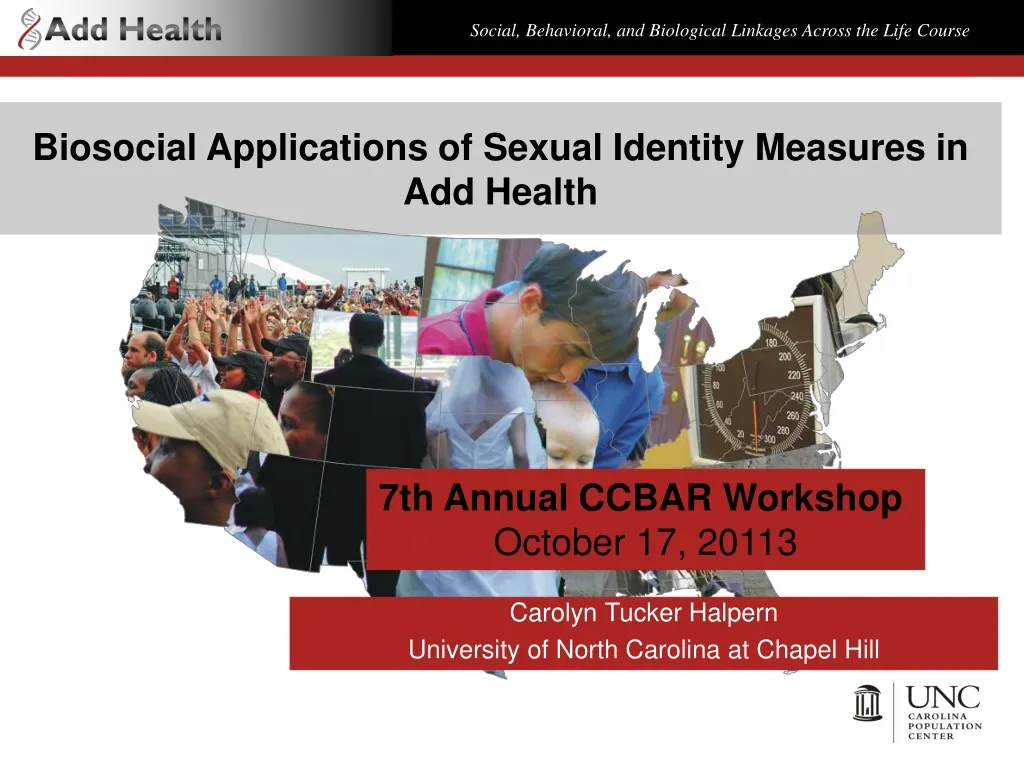
Biosocial Applications of Sexual Identity Measures in Add Health. 7th Annual CCBAR Workshop October 17, 20113. Carolyn Tucker Halpern University of North Carolina at Chapel Hill. Outline. Overview of Add Health design Indicators of orientation available in Add Health

E N D
Biosocial Applications of Sexual Identity Measures in Add Health 7th Annual CCBAR Workshop October 17, 20113 Carolyn Tucker Halpern University of North Carolina at Chapel Hill
Outline • Overview of Add Health design • Indicators of orientation available in Add Health • Size of sexual minority population: variation by indicator and interview wave • Available biomarkers & rationale for selection • Illustrative research, completed and possibilities • The Future --- Wave V?
School Sampling Frame = QED HS HS HS HS HS H Feeder Feeder Feeder Feeder Feeder SamplingFrame of Adolescents and Parents N = 100,000+ (100 to 4,000 per pair of schools) Ethnic Samples High Educ Black Disabled Sample Puerto Rican Saturation Samples from 16 Schools Chinese Main Sample 200/Community Genetic Samples Cuban Cuban Identical Twins Fraternal Twins Full Sibs Half Sibs Unrelated Pairs in Same HH
In-School Administration In-Home Administration School Admin 144 Adolescents in grades 7-12 20,745 Wave I 1994-1995 (79%) Parent 17,670 Students 90,118 School Admin 128 Wave II 1996 (88.6%) Adolescents in grades 8-12 14,738 Wave III 2001-2002 (77.4%) Young Adults Aged 18-26 15,197 Partners 1,507 Wave IV 2007-08 (80.3%) IIV Study ~ 100 Adults Aged 24-32 15,701
Race and Ethnic Diversity in Add Health Missing on race/ethnicity=59
Indicators of Sexual Orientation in Add Health Attraction to same and/or other sex Sexual partnerships with same and/or other sex Identification/self-labeling
Indicators of Sexual Orientation Romantic Attraction to same and/or other sex Waves I – IV Attracted to males? Attracted to females? Sexual partnerships with same and/or other sex Waves I -- IV Possible number of partners varies across waves Type of partner-specific information available varies across waves
Indicators of Sexual Orientation Identification/self-labeling (Waves III, IV) Please choose the description that best fits how you think about yourself 100% heterosexual (straight) mostly heterosexual (straight), but somewhat attracted to people of your own sex bisexual that is, attracted to men and women equally mostly homosexual (gay), but somewhat attracted to people of the opposite sex 100% homosexual (gay) not sexually attracted to either males or females
How large is the sexual minority population in Add Health? Estimates vary, depending on: Eligibility criteria used for analysis samples Indicator(s) used Developmental period(s)
Non-exclusively heterosexual identity 112 (22.7%) 15 (3.3%) 46 (11.0%) 187 (33.1%) 107 (21.2%) Has had a same-sex partner 35 (7.8%) Attracted to the same sex 4 (1.0%) Consistency across Indicators Sexual Minority Males, Wave 4, n=506 (9.0% of males in analytic sample)
Non-exclusively heterosexual identity 485 (30.7%) 159 (10.6%) 215 (14.1%) 395 (26.1%) 238 (16.1%) Has had a same-sex partner 26 (1.9%) Attracted to the same sex 8 (0.4%) Consistency across Indicators Sexual Minority Females, Wave 4, n=1,526 (24.3 % of females in analytic sample)
Percentages of Respondents who Report Same-sex Attraction, Add Health Waves I, II, III Reporting NNN: 86% of Males 82% of Females N=No; Y=Yes Halpern CT, Udry JR. Patterns of same- and opposite-sex attraction, romance, and sexual behavior from adolescence to adulthood: A prospective analysis. Society for the Scientific Study of Sexuality Meetings, San Antonio, TX, November 2003
Add Health Choice of Biological Data • Biological states that are reasonably prevalent in the general population of youth & young adults • Biological states and process theoretically and/or empirically linked to future health • Measures that can characterize those processes • Feasible for a large scale, national field study • Valid and reliable • Appropriate for longitudinal designs • Non-invasive, cost-efficient, practical
Biospecimen Participation • 99% Height, weight, waist (all Waves) • 99% Blood pressure (Wave IV) • 96% Saliva (DNA Wave IV; 78% archived) • 95% Saliva (HIV; Wave III) • 94% Blood Spots (Wave IV; 76% archived) • 92% Urine (STIs; Wave III)
Intra-Individual Variation (IIV) Study Repeat collection of biomarkers on the same 100 individuals over a short interval to estimate reliability of measures. Randomly selected ½ IIV cases in pretest and ½ in main study. Interview IIV respondents twice, 1-2 weeks apart Visit 1: full interview + biomarkers Visit 2: abbreviated interview + biomarkers Process the biomarkers (labs and technicians masked) Compute the intra-class correlation (ICC) as a measure of reliability Use reliability estimates to monitor biomarker data quality and correct for measurement error.
Behavioral, Social, Contextual Content Across Waves Waves I, II Demographic Family, siblings, friends Education, work Physical and mental health Daily activities and sleep Relationships Sexual, & fertility histories Substance use Delinquency and violence Attitudes, religion Economics, expectations Psychological, personality • Wave III • Demographic • Family, siblings, friends • Education, work, military • Physical and mental health • Daily activities and sleep • Relationships • Sexual, & fertility histories • Substance use • Involvmt w/criminal justice sys • Attitudes, religion • Economics, expectations • Psychological, personality • Children and parenting • Civic participation • Gambling • Mentoring • Wave IV • Demographic • Family, siblings, friends • Educ, work, military (records) • Physical and mental health • Daily activities and sleep • Relationships • Sexual, & fertility histories • Substance use and abuse • Involvmt w/criminal justice sys • Work attitudes and chars, relig • Economics, expectations • Big 5 Personality, stressors • Children and parenting • Civic participation • Cognitive function • Psychosocial factors
Illustrative Research • Examples to date • Future possibilities
Sexual Minority Definitions “Any 1 indicator:” Respondents endorsing at least one of the indicators of minority status “All 3 indicators:” Respondents endorsing all three indicators “Heterosexual majority:” Respondents endorsing none of the three indicators Strutz K, Herring AH, Halpern CT. Disparities in health status and health care access for young adult sexual minorities in the United States. Under review.
Health Disparities in Young Adulthood Based on Self-Report • Numerous, especially for females • Evident for “any 1 indicator” and “all 3” indicators • Examples • Overall self-rated health • Depression, anxiety disorder • STI diagnoses • Health care access & foregone care • Similar patterns regardless of concordance/discordance in indicators Strutz K, Herring AH, Halpern CT. Disparities in health status and health care access for young adult sexual minorities in the United States. Under review.
Strutz K, Herring AH, Halpern CT. Disparities in health status and health care access for young adult sexual minorities in the United States. Under review.
Strutz K, Herring AH, Halpern CT. Disparities in health status and health care access for young adult sexual minorities in the United States. Under review.
Strutz K, Herring AH, Halpern CT. Disparities in health status and health care access for young adult sexual minorities in the United States. Under review.
Strutz K, Herring AH, Halpern CT. Disparities in health status and health care access for young adult sexual minorities in the United States. Under review.
Strutz K, Herring AH, Halpern CT. Disparities in health status and health care access for young adult sexual minorities in the United States. Under review.
Strutz K, Herring AH, Halpern CT. Disparities in health status and health care access for young adult sexual minorities in the United States. Under review.
Sexual Identity & CVD Markers in Young Adulthood (Wave IV) Compared with heterosexuals, in adjusted models: Gay/bisexual identified men had elevated: Diastolic blood pressure (Mean 84.06 vs 81.62 mmhg) Pulse rate (mean 75.64 vs 72.48) CRP (mean 2.16 vs 2.07 mg/L) Lesbian/bisexual identified women had lower: CRP (2.28 vs 2.53 mg/L) Despite more CVD risk factors If replicated, differential timing in physical evidence of CVD risk Hatzenbuehler ML, McLaughlin, KA, Slopen N. Sexual Orientation Disparities in Cardiovascular Biomarkers Among Young Adults. Am J Prev Med 2013;44(6):612–621
Capitalizing on Add Health to Better Understand Pathways to Health Extensive, multilevel social, psychological, behavioral, environmental, and biological data Longitudinal design, beginning in early adolescence, allows examination of timing, duration, and accumulated impacts of social and environmental factors Map pathways leading to differences in mental and physical health, and consequences across the life course
Genetic Data Diverse phenotypic data, coupled with extensive social and contextual data, offer many opportunities to test gene by environment (GxE) interactions Candidate genes in the dopamine and serotonin pathways have been genotyped Genome-wide genotyping ongoing for samples provided by 12,000 respondents who consented to archive their specimens for further testing
Social Disadvantage and Health • Exposure to social disadvantage early in life associated with poor health in later adulthood. • Less attention to adolescent and young adult stages of life course. • Seek autonomy in choosing their own environments, health behaviors, habits and future lifestyles. • Physical, physiological, and neurological changes linked to puberty make adolescents especially receptive to their broadening environments.
Neighborhood Disadvantage & Blood Pressure Levels: Exposure to higher levels of neigh disadvantage associated with greater hypertension risk at any point in time; Timing: Exposure during sensitive period of adolescence more detrimental for subsequent health than transition to adulthood; Duration: Longer durations of neigh disadvantage over time associated with greater hypertension risk; Mobility: Those who move out of disadvantaged neighs will experience better health than those who remain. Gerkin K, Harris KM. 2013 Population Association of America Presentation.
Findings • Social disadvantage early in life can leave a biological imprint that may affect later adult health. • Adolescence is a sensitive period • Neighborhood disadvantage experienced during adolescence more detrimental for future blood pressure than during transition to adulthood. • Cumulative effects also important, but adolescence seems to anchor these effects and likely set the health trajectory into adulthood. • Associations did not differ significantly by race or sex • Extension to sexual minorities?
Future Possibilities: Add Health Wave V Program Project • Chronic conditions are occurring at increasingly younger ages in the US • Add Health cohort is entering the ages when chronic disease will explode • Life stages of adolescence and the transition to adulthood are virtually ignored in disease models, and yet these are the stages when young people begin to choose their environments, health behaviors, habits and future lifestyles • Life stages especially relevant to sexuality & sexual identity, hypotheses related to minority stress
Wave V Scientific Objective • Trace the additive and interactive social, biological, genetic, and behavioral pathways that lead to chronic disease by • Linking adult health and disease risk to physical and social exposures that occur during • Gestation • Childhood • Adolescence • Transition to early adulthood • Young adulthood
Wave V Interview 2015-2018 • Original Wave I respondents who will be moving through their 4th decade of life (31-42 years). • Collect the following data: • survey data reflecting both longitudinal and new information; • longitudinal and new biological data and specimens; • geographic locations for longitudinal spatial data; • and consent to obtain birth records of Add Health respondents born in a subset of states.
Wave V: Biological data • Repeat measures of biomarkers that indicate change and onset of chronic disease: • anthropometrics • blood pressure • Whole blood assays of: • Inflammation • Lipids • Glucose • Glycosylated hemoglobin • New biomarkers of kidney disease: • Creatinine • Cystatin C
Add Health Project Team • Kathleen Mullan Harris, PI & Director • Carolyn Tucker Halpern, Co-I & Deputy Director • Eric Whitsel, Co-PI IV Biology Core • Jon Hussey, Co-investigator • Joyce Tabor, Add Health Data Manager • Ley Killeya-Jones, Add Health Project Manager • Sarah Dean, Assistant Project Manager
Add HealthCo-Funders National Institute of Child Health and Human Development* National Cancer Institute* National Center for Health Statistics, Centers for Disease Control and Prevention, DHHS National Center for Injury Prevention and Control, Centers for Disease Control and Prevention, DHHS* National Center for Minority Health and Health Disparities* National Institute of Allergy and Infectious Diseases* National Institute of Deafness and Other Communication Disorders* National Institute of General Medical Sciences National Institute of Mental Health National Institute of Nursing Research* National Institute on Aging* National Institute on Alcohol Abuse and Alcoholism* National Institute on Drug Abuse* National Science Foundation* Office of AIDS Research, NIH* Office of the Assistant Secretary for Planning and Evaluation, DHHS* Office of Behavioral and Social Sciences Research, NIH* Office of the Director, NIH Office of Minority Health, Centers for Disease Control and Prevention, DHHS Office of Minority Health, Office of Public Health and Science, DHHS Office of Population Affairs, DHHS* Office of Research on Women's Health, NIH* • *Wave 4 co-funders Data made available to more than 4
Add Health Web Page http://www.cpc.unc.edu/projects/addhealth • Online code books • User guides to inform data analysis • Bibliography of Add Health publications • Information about the bi-annual Add Health Users Conference in Washington DC • Information about data access