Download
1 / 9
90 likes | 209 Views
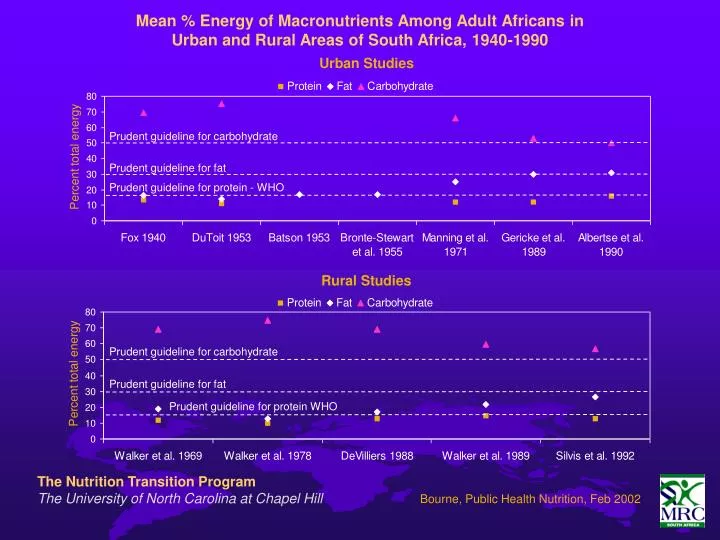
Mean % Energy of Macronutrients Among Adult Africans in Urban and Rural Areas of South Africa, 1940-1990. Urban Studies. Prudent guideline for carbohydrate. Prudent guideline for fat. Prudent guideline for protein - WHO. Rural Studies. Prudent guideline for carbohydrate.

E N D
Mean % Energy of Macronutrients Among Adult Africans in Urban and Rural Areas of South Africa, 1940-1990 Urban Studies Prudent guideline for carbohydrate Prudent guideline for fat Prudent guideline for protein - WHO Rural Studies Prudent guideline for carbohydrate Prudent guideline for fat Prudent guideline for protein WHO The Nutrition Transition Program The University of North Carolina at Chapel Hill Bourne, Public Health Nutrition, Feb 2002
Anthropometric Pattern of Black South African Adults Aged 15 – 65+ Years (Age Standardised - World Population) SADHS WHO, 1997 The Nutrition Transition Program The University of North Carolina at Chapel Hill Bourne, Public Health Nutrition, Feb 2002
The Anthropmetric Status of Children 1 – 9 Years of Age: South Africa 1999 (NFCS)Percentage With < - 2 Sds The Nutrition Transition Program The University of North Carolina at Chapel Hill Bourne, Public Health Nutrition, Feb 2002
The Anthropometric Status of Children 1 – 9 Years of Age Nationally and by Area Residence: South Africa 1999 (NFCS) Percentage With W/H > + 2sds The Nutrition Transition Program The University of North Carolina at Chapel Hill Bourne, Public Health Nutrition, Feb 2002
1996 Male DeathsN=185 790 1996 Female DeathsN=140 087 Other communicable Other Other Respiratory 8.40% Infectious/ external Und Other Und communicable 10.41% disease Infectious/ Parasitic 1.20% external external external 5.50% Parasitic 12.89% 23.29% 1.80% 9.02% 13.43% Ill-defined 16.75% Malignant Ill-defined Malignant Neoplasms 13.15% Neoplasms 8.54% 9.35% Cardiovascular Other non- Other non- communicable Cardiovascular communicable 24.28% 16.60% 9.30% 16.11% The Nutrition Transition Program The University of North Carolina at Chapel Hill Bourne, Public Health Nutrition, Feb 2002
Adult Health Indicators, SADHS 1998 The Nutrition Transition Program The University of North Carolina at Chapel Hill Bourne, Public Health Nutrition, Feb 2002
50000 1990 Males 40000 35000 30000 30000 25000 20000 Total 20000 Total 15000 non-AIDS 10000 non-AIDS 10000 5000 0 0 0-4 0-4 10-14 20-24 30-34 40-44 50-54 60-64 70-74 80-84 10-14 20-24 30-34 40-44 50-54 60-64 70-74 80-84 70000 60000 Total 50000 non-AIDS 40000 30000 60000 20000 50000 10000 40000 Total 0 30000 non-AIDS 20000 0-4 20-24 50-54 10-14 30-34 40-44 60-64 70-74 80-84 10000 0 0-4 2010Males 120000 2010 Females 100000 10-14 20-24 30-34 40-44 50-54 60-64 70-74 80-84 100000 80000 80000 60000 60000 40000 Total 40000 Total non-AIDS 20000 20000 non-AIDS 0 0 0-4 0-4 10-14 20-24 30-34 40-44 50-54 60-64 70-74 80-84 80-84 20-24 10-14 30-34 40-44 50-54 60-64 70-74 Projected Age and Sex Pattern of Number of Deaths for 1990, 2000 and 2010, ASSA600 (note the axes differ for each graph) 1990 Females 2000 Males 2000 Females ASSA Bourne, Public Health Nutrition, Feb 2002
1996 Female DeathsN=140 087 1996 Male DeathsN=185 790 Bourne, Public Health Nutrition, Feb 2002