Download

1 / 76
760 likes | 762 Views
This module discusses the incidence, mortality, and etiology of cancer. Topics include cancer statistics, major cancers, prevention, and staging. The module also explores risk factors and the pathophysiology of cancer.

E N D
Module 1: Incidence, Mortality and Etiology Instructor Mary Magee Gullatte, PhD, RN, APRN, BC, AOCN (c) 2010 Gullatte. PhD, RN Unit 2: Cancer Biology, Etiology, & Epidemiology
Objectives At the conclusion of this session the learner will be able to… 1. Discuss the overall state and national cancer incidence for males and females. 2. Review cancer mortality statistics by top five cancers. 3. Discuss the general etiology of cancer in adults. (c) 2010 Gullatte. PhD, RN Unit 3: Major Cancers, Prevention, & Staging
Introduction of Unit 1 Cancer Biology, Etiology, and Epidemiology (c) 2010 Gullatte. PhD, RN Unit 3: Major Cancers, Prevention, & Staging
Definitions Cancer Incidence: the number of new cases of cancer or disease. Cancer Mortality: the number of deaths attributed to cancer. Prevalence: the number of cancer cases at a given time in a specific population. Relative Survival Rate: which measures the survival of the cancer patients in comparison to the general population to estimate the effect of cancer. (c) 2010 Gullatte. PhD, RN http://seer.cancer.gov/statfacts/html/all.html#incidence-mortality
2010 Cancer Incidence & Mortality SEER Cancer Statistics National Cancer Incidence and Mortality Incidence Mortality 5 Leading cancers Incidence Mortality Web site: http://seer.cancer.gov (c) 2010 Gullatte. PhD, RN
Cancer Incidence Rates by RaceRace/Ethnicity Male & Female All Races 538.9 per 100,000 men 408.0 per 100,000 women White: 541.5 per 100,000 men; 419.6 per 100,000 women Black: 624.0 per 100,000 men; 399.1 per 100,000 women Asian/Pacific Islander: 346.5 per 100,000 men; 288.9 per 100,000 women American Indian/Alaska Native: 335.8 per 100,000 men ; 306.3 per 100,000 women Hispanic: 394.8 per 100,000 men; 309.2 per 100,000 women (c) 2010 Gullatte. PhD, RN Source: SEER: 2003-2007 from 17 SEER geographic areas
National Cancer Statistics 2009Incidence and Mortality Projected New Cancer Cases 2009 1,479,350 cancer cases 562,340 deaths The Good News about Cancer (decrease in incidence) men (1.8% per year from 2001 to 2005) women (0.6% per year from 1998 to 2005) (c) 2010 Gullatte. PhD, RN Jemal, Siegel, Ward, Hao, Xu & Thun (2009). CA Cancer Journal for Clinicians.
National Cancer Statistics 2009Incidence and Mortality The Good News about Cancer : decrease in incidence of… Three major cancer sites in men (lung, prostate, and colon and rectum Two major cancer sites in women (breast and colorectal). (c) 2010 Gullatte. PhD, RN
Overall Cancer Death Rates Decreased in men by 19.2% between 1990 and 2005 decreases in lung (37%), prostate (24%), and colorectal (17%) cancer rates accounting for nearly 80% of the total decrease Decreased women decreased by 11.4%, between 1991 and 2005 decreases in breast (37%) and colorectal (24%) cancer rates, accounting for 60% of the total decrease Overall decrease in both male & female is ~650,000 deaths from cancer over the past 15-year period (c) 2010 Gullatte. PhD, RN Jemal, Siegel, Ward, Hao, Xu & Thun (2009). CA Cancer Journal for Clinicians.
Rates for Georgia (per/100,000) New cases overall : Incidence 465.5 All cases 39,080 Female breast 5,370 Colorectal 3,750 Lung and Bronchus 6,150 Melanoma and skin 2,040 Non Hodgkin's Lymphoma 1,560 Prostate 5,210 (c) 2010 Gullatte. PhD, RN Jemal, Siegel, Ward, Hao, Xu & Thun (2009). CA Cancer Journal for Clinicians.
Cancer Relative Survival The overall 5-year relative survival for 1999-2006 from 17 SEER geographic areas was 66.0%. Five-year relative survival by race and sex was: 66.8% for white men; 67.0% for white women; 60.6% for black men; 54.9% for black women. (c) 2010 Gullatte. PhD, RN http://seer.cancer.gov/statfacts/html/all.html#incidence-mortality
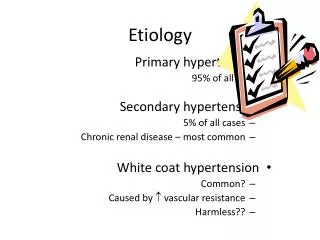
(c) 2010 Gullatte. PhD, RN Etiology of Cancer
Etiology/Cause and Associated Risk Factors of Cancer Environmental Factors Diet Air Ultraviolet Radiation Heredity/genetic Factors Chemicals Age Race and Ethnicity Gender Viruses (c) 2010 Gullatte. PhD, RN
Risk Factors, cont’d. Environmental Factors Associated with Cancer Causation Tobacco Diet Alcohol Lack of Physical Activity Occupational Exposures Pollution Reproductive factors and sexual behaviors (c) 2010 Gullatte. PhD, RN
Tobacco (c) 2010 Gullatte. PhD, RN
Diet (c) 2010 Gullatte. PhD, RN
Alcohol (c) 2010 Gullatte. PhD, RN
Risk Factors, cont’d. Viruses Radiation Socioeconomic Factors Occupational Exposures (c) 2010 Gullatte. PhD, RN
Viruses (c) 2010 Gullatte. PhD, RN HIV HSV2 HPV
Radiation (c) 2010 Gullatte. PhD, RN
Occupational (c) 2010 Gullatte. PhD, RN
(c) 2010 Gullatte. PhD, RN Pathophysiology
Cellular Replication Cell Cycle Normal vs. Neoplastic Growth Cell Phase Specificity Cell cycle phase specific Cell cycle phase non-specific (c) 2010 Gullatte. PhD, RN
Normal Cells Proliferation and Growth Growth patterns Hypertrophy Hyperplasia Metaplasia Dysplasia (c) 2010 Gullatte. PhD, RN
Cell Cycle Go Post mitotic resting phase G1 Post mitotic/pre-synthesis S Synthesis (DNA synthesis) G2 Post-synthetic/pre mitotic phase M Mitosis – single cell is separated in two (c) 2010 Gullatte. PhD, RN
Mitosis Interphase Prophase Metaphase Anaphase Telophase (c) 2010 Gullatte. PhD, RN
Benign and Malignant Cell Characteristics (c) 2010 Gullatte. PhD, RN
Benign Encapsulated No metastasis Partially differentiated Slight vascularity (c) 2010 Gullatte. PhD, RN
Malignant Rarely encapsulated Poorly differentiated Metastatic Abnormal cells Moderate to marked vascularity (c) 2010 Gullatte. PhD, RN
Cancer Cell Origin Connective tissue Endothelium Epithelium Musculoskeletal Central Nervous System (c) 2010 Gullatte. PhD, RN
Cancer Cell Growth Gompertz Growth Curve Growth Factor (GF) Doubling time (DT) (c) 2010 Gullatte. PhD, RN
Cancer Cell Growth Cellular properties Contact inhibition Anchorage dependence Restrictive control (c) 2010 Gullatte. PhD, RN
Factors of Carcinogenesis Initiating Promoting Reversing Oncogene Progression Transformation (c) 2010 Gullatte. PhD, RN
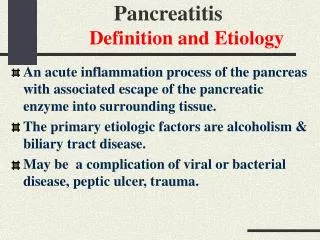
Initiator Caner initiator or carcinogen act either by direct effect or damage to the DNA…irreversible genetic damage Example: known carcinogens >asbestos (c) 2010 Gullatte. PhD, RN
Promoter Cancer promoters aid n the alternation or injury to DNA. When change does occur once cells initialized. Examples: Bile acids, sex hormones, synthetic and natural chemicals (fluorocarbons), nitrites (c) 2010 Gullatte. PhD, RN
Progression Cancer progression represents the expression of the malignant mutation and acquire more aggressive characteristics over time. (c) 2010 Gullatte. PhD, RN
Oncogene Cancer oncogens control cell growth, specialization and differentiation. (c) 2010 Gullatte. PhD, RN
Reversing agents Reversing agents are those biochemical compounds, vitamins that when taken can effect DNA repair to reverse the initial effects of cancer promoters Example: antioxidants (vitamins) (c) 2010 Gullatte. PhD, RN
Transformation The point of no return for cancer formation. Usually results in a genetic alteration of the cell at the DNA level. (75-80% of all human cancers are environmental carcinogens). (c) 2010 Gullatte. PhD, RN
Theories of Carcinogenesis Berenblum’s Theory_ proposed in 1947 Cancer occurs as the result of two distinct events: initiation and promotion Three stage theory of carcinogenesis Initiation (might be reversible) Promotion (might be reversible) Progression (irreversible) (c) 2010 Gullatte. PhD, RN
Cancer Cell Invasion Direct Extension Lymphatic Hematogenic Metastases (c) 2010 Gullatte. PhD, RN
Major Cancer Sites Breast Lung Colon and Rectum Prostate Skin Cervix (c) 2010 Gullatte. PhD, RN
Breast Cancer (c) 2010 Gullatte. PhD, RN
Breast Cancer Leading incidence of cancer in women and second in mortality only to lung cancer 1% of breast cancers occur in men Strong genetic predisposition in women with BRCA1 mutation BRCA1 gene has about an 85 percent chance of developing breast cancer the median age at diagnosis was 61 years of age (2003-2007) (c) 2010 Gullatte. PhD, RN
Breast Cancer Incidence Rates byRace/Ethnicity in Females 2003-2007 All Races122.9 per 100,000 women White126.5 per 100,000 women Black118.3 per 100,000 women Asian/Pacific Islander 90.0 per 100,000 women American Indian/Alaska Native 76.4 per 100,000 women Hispanic 86.0 per 100,000 women (c) 2010 Gullatte. PhD, RN
Breast Cancer 5 yr Survival (c) 2010 Gullatte. PhD, RN http://seer.cancer.gov/statfacts/html/breast.html
Lung and Bronchus Cancer (c) 2010 Gullatte. PhD, RN
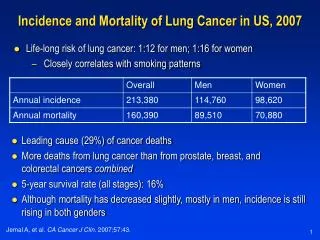
Lung & Bronchus Cancer Leading cause of cancer death in both men and women in the USA (c) 2010 Gullatte. PhD, RN
Lung and Bronchus Incidence Rates by RaceRace/Ethnicity Male & Female 2003-2007 All Races Men 76.2 per 100,000 Women 52.4 per 100,000 White 76.3 per 100,000 men 54.7 per 100,000 women Black101.2 per 100,000 men 54.8 per 100,000 women Asian/Pacific Islander 52.9 per 100,000 men 28.1 per 100,000 women American Indian/Alaska Native 52.7 per 100,000 men 39.7 per 100,000 women Hispanic b41.4 per 100,000 men25.4 per 100,000 women (c) 2010 Gullatte. PhD, RN
Lung: Distribution and 5-year Relative Survival by Stage at Diagnosis for 1999-2006, all Races, both Sexes (c) 2010 Gullatte. PhD, RN http://seer.cancer.gov/statfacts/html/breast.html