Download
1 / 26
270 likes | 307 Views
Effects of Solar Storms on the Venusian Ionosphere. International Venus Conference April 7, 2016. Candace Gray - New Mexico State University

E N D
Effects of Solar Storms on the Venusian Ionosphere International Venus Conference April 7, 2016 Candace Gray - New Mexico State University Nancy Chanover, Tom Slanger, Karan Molaverdikhani, Kerstin Peter, Bernd Häusler, Silvia Tellman, Martin Pätzold, Oliver Witasse, Pierre-Louis Blelly, Glyn Collinson NASA Earth and Space Science Fellowship Award #NN12AM70H
How does Venusian 557.7nm intensity respond to solar storms? • Emitting altitude and key chemical processes? • How does the Venusian ionosphere respond to CMEs? • How do these results compare with Mars?
Variable • Solar wind • Charge particle precipitation • Electron impact • O2+ + e → O(1S, 1D) + O(3P) Zhang et. al 2012
Emission expected to be present • Not detected in 1970s
Venus Earth Venus Earth Keck Slanger et al. 2001
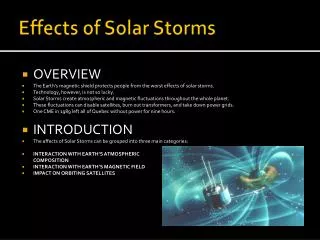
X-class solar flares • Strongest flares • Brightest EUV emission • Nightglow • Short duration (min - hours) • Coronal mass ejections (CMEs) • Plasma ejection • Aurora • 1 - 2 day arrival time
3.5 m Astrophysical Research Consortium (ARC) Telescope • ARC Echelle Spectrograph • High resolution (R ~ 35,000) • 3500 – 10,000 Å • Two 6-week windows / 2 years
Telescope override • 3 nights/window • Storm chasing
Solar Flare Solar Flare + CME Solar Flare Before and after CME
June 15 and June 16, 2012 • Before and after CME flare Electron Energy Density June 15, 2012 June 16, 2012 Nightside Nightside Energy (eV) 105 1000 Flux (cm-2 sr-1 s-1) 100 104 10 103 1 Differential Energy Flux (cm-2 sr-1 ev-1 s-1) Differential Energy Flux (cm-2 sr-1 ev-1 s-1) 107 107 106 106 12 eV 12 eV 105 105 50 eV 70 eV 104 104 103 103 103 103 1 10 100 1 10 100 1 10 100 1 10 100 1 10 100 1 10 100 Electron Energy (eV) Electron Energy (eV) Gray et al. 2016, submitted
Dayside • Persistent V1 and V2 layers • Solar flux • Nightside • Variable • Ion flow across terminator Martin Pätzold et al. 2007
200 Before CME After CME 180 Altitude (km) 557.7 nm detection 160 V2 140 140 V1 120 100 0 0.5 1.0 1.5 2.0 Electron Density x 104 (cm-3)
M2 M1
TRANSCAR • VEX electron flux and energy inputs • Compare pre/post CME green line emission • Increase in 557.7nm emission • O + e strongest source • No increase in V1 layer electron density
What happens to Venus after a CME impact? • Increased solar wind dynamic pressure • Compressed ionosphere • “Disappearing” V2 layer • Electron precipitation • Auroral emission Russell et. al 2006
Brace and Kilore 1999 200 Before CME After CME 180 Altitude (km) 180 160 160 V2 140 140 V1 120 100 0 0.5 1.0 1.5 2.0 Electron Density x 104 (cm-3)
Green line a unique aurora • O + e likely source of green line emission • Increase in dynamic pressure from a CME • Compress ionopause, restricting ion flow • Reduce V2 electron density • Drive plasma to the nightside • Increase green line emission • Typical of non-magnetic planets?