Download
1 / 27
270 likes | 280 Views
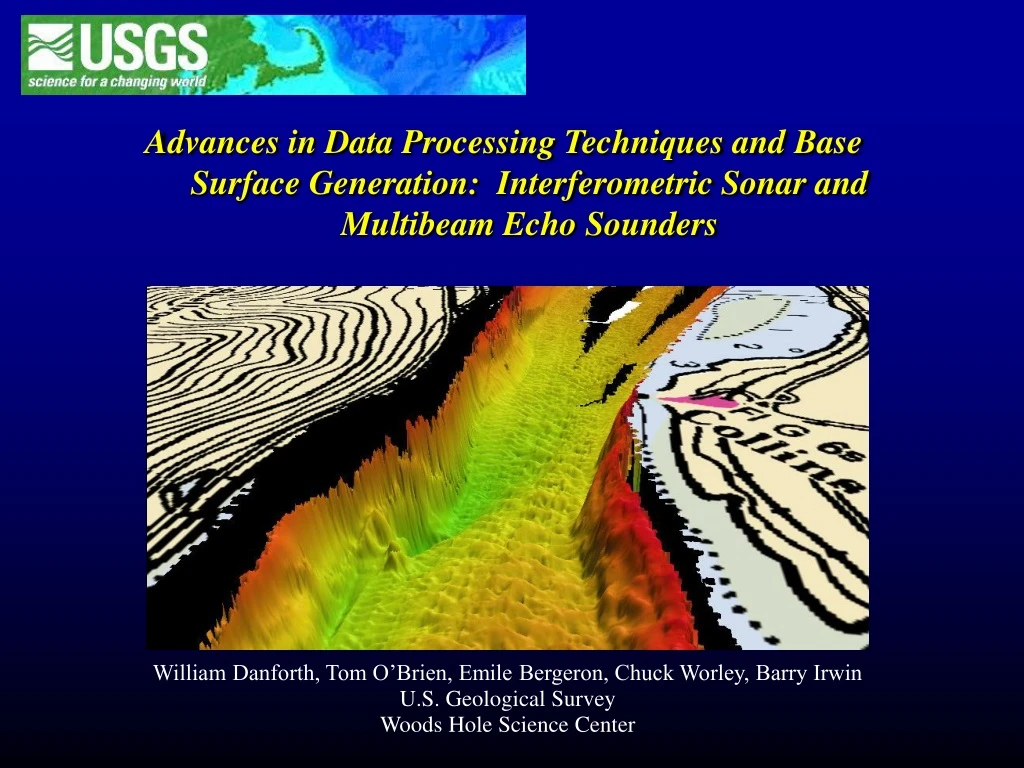
Advances in Data Processing Techniques and Base Surface Generation: Interferometric Sonar and Multibeam Echo Sounders. William Danforth, Tom O’Brien, Emile Bergeron, Chuck Worley, Barry Irwin U.S. Geological Survey Woods Hole Science Center. USGS Coastal & Marine Geology Program

E N D
Advances in Data Processing Techniques and Base Surface Generation: Interferometric Sonar and Multibeam Echo Sounders William Danforth, Tom O’Brien, Emile Bergeron, Chuck Worley, Barry Irwin U.S. Geological Survey Woods Hole Science Center
USGS Coastal & Marine Geology Program National Science Field Centers Woods Hole, Massachusetts (Woods Hole Science Center) Menlo Park / Santa Cruz, California (Western Coastal & Marine Geology) St. Petersburg, Florida (Center for Coastal & Watershed Studies)
USGS Coastal & Marine Geology Program Mapping Activities: Lacustrine – Estuarine – Nearshore - Offshore *Habitat Geoscience *Coastal Erosion and Geologic Framework *Climate Change * Nearshore Sediment Dynamics * Ecosystems and Coastal Ground Water *Predicting Effluent Pathways *Coastal and Marine Sediment Contaminants *Gas Hydrates *Marine Aggregates (sand & gravel) * Earthquake and Tsunami Hazards
WHSC Sea Floor Mapping Scientific & Technological Advances South Carolina (1999-2003) Continued focus geologic framework & nearshore surface processes Systematic Mapping of inner continental shelf Multibeam USGS/CHS/ UNB/NOAA (1994) Gulf of Farallones (1989) CMGP Research Deep to Shallow Significant system developments (expand shallow water capability) R/V Rafael, Vans & Swath Bathymetry GLORIA (EEZ) Real-time Processing (1989) Digital Data Acquisition High-Resolution Data Acquisition Development & Growth of WHSC Sea Floor Mapping 1980 1990 2000 2008
5 meters 15 WHSC Sea Floor Mapping Swath Bathymetric System Incorporation of high-resolution swath bathymetry augments geologic framework studies by defining sea floor morphology System operation: < 5 - 200 m water depth R/V Rafael with bathymetric sonar deployed SEA, SwathPlus bathymetric sonar (117 kHz & 234 kHz) Angle Range θ
WHSC Sea Floor Mapping Swath Bathymetric System Shallow water surveying (< 30 m) Interferometric Sonar – wide swath system Interferometric Sonar Multibeam Echo Sounder Swath Width
WHSC Sea Floor Mapping Swath Bathymetric System SEA, Ltd’s SwathPlus Bathy Sonar Coverage Profile Targets
WHSC Sea Floor Mapping Swath Bathymetric System and the Common Data Set • OBJECTIVES: • Map the common data set area using a 6x water depth trackline spacing (twice the IHO order 1 spec). • Compare/contrast the resulting swath coverage and final grids with Multibeam Echo Sounder (MBES) coverage after using a single processing package on the raw data- CARIS. • Attempt to streamline the data processing flow and DTM surface generation using new algorithms such as the Combined Uncertainty and Bathymetry Estimator (CUBE). • Attempt to quantify Total Propagated Error (TPE) of the soundings using a preliminary sonar model for SwathPlus. • Compare the TPE statistics with those of the MBES systems. • Visually and statistically compare the SwathPlus surface to those created using the MBES data.
WHSC Sea Floor Mapping Data Acquisition, October 2007 • Survey Vessel R/V Rafael • Sea SwathPlus 234 kHz transducers and data acquisition software • Coda Octopus F180R MRU • Ashtech RTK navigation • Applied Microsystems SVP (both hand deployed and mounted at the head for SSV) • Collected 6144 samples / swath
WHSC Sea Floor Mapping Common Data Set Processing Flow SwathPlus SXP data - 234 kHz Simrad EM3002D “raw.all” data - 307 kHz Reson 7125 XTF data - 400 kHz CARIS • Create Vessel file for each data type • Apply motion and nav if necessary • Generate TPE sounding statistics for each line • Incorporate lines into a CUBE surface using default settings Fledermaus • Statistical and Visual comparisons
WHSC Sea Floor Mapping TPE Computation for Hz and Dp values Takes into account: • RP placement (usually the MRU) • Offsets to sensors and transducers • Mounting offsets • Patch test results • Accuracy of MRU and system timing • Specifications from individual sonar models
WHSC Sea Floor Mapping Initial Grids using the TPE and CUBE approach Simrad EM3002D And there was NO swath editing performed!! Reson 7125
WHSC Sea Floor Mapping Initial Grids using the TPE and CUBE approach SwathPlus 234 kHz
WHSC Sea Floor Mapping Processing benefits using the TPE and CUBE approach • Semi-automates the DTM generation using very dense data sets (Interferometric and MBES) • Preserves significant bathymetric detail on a first pass • Auxiliary outputs can be used for further editing decisions based on error analysis and hypothesis testing • Helps to significantly reduce point by point editing traditionally used to eliminate spurious soundings
WHSC Sea Floor Mapping Further CUBE processing
WHSC Sea Floor Mapping Comparing TPE values IHO Order 1: 5 m horizontal 0.53 m vertical at 13.6 meters Depth = 13.6 m
WHSC Sea Floor Mapping Comparing SwathPlus soundings to the Simrad CUBE surface
WHSC Sea Floor Mapping Comparing SwathPlus soundings to the Reson CUBE surface
WHSC Sea Floor Mapping Surface differencing: SwathPlus compared to Reson and Simrad
WHSC Sea Floor Mapping Drilling down….
WHSC Sea Floor Mapping Visual comparison: Profile over a small feature Simrad EM3002D CUBE surface
WHSC Sea Floor Mapping Visual comparison: Profile over a small feature Reson 7125 CUBE surface
WHSC Sea Floor Mapping Visual comparison: Profile over a small feature SwathPlus 234 kHz CUBE surface
WHSC Sea Floor Mapping So what does all this tell us? • Interferometric sonar data tend to have a higher standard deviation across the swath as compared to MBES systems, however the resulting bathymetric surface retains very closely the level of detail see in surfaces created using MBES data. • Semi-automated processing and generation of bathymetric surfaces from interferometric sonar data is viable and preserves the true nature of the seafloor, thus significantly reducing the post processing effort and time sink required to generate a reliable bathymetric surface from these data. Where do we go from here? • The advantages of interferometric methods in waters shallower than 20 meters are numerous, but the question of vertical resolution and target detection, especially for hydrographic surveys, still needs further study .. And maybe…
WHSC Sea Floor Mapping Interferometry on an ASV ??? ASV: Autonomous Surface Vessel • Shallow water • Sidescan Sonar • Edgetech Chirp (4 – 24 kHz) • Single Beam EchoSounder • ADCP • Additional Sensors or Reconfigure • Modular • Numerous Sensors • Easily Modified • Autonomous or manual • Integrated Systems
WHSC Sea Floor Mapping Sea Floor Mapping Systems Surficial and Sub-bottom Systems Sidescan-sonar Seismic Reflection Swath Bathymetry Sampling Video/photography Core and Grab Samplers Navigation WAAS , DGPS, RTK