Download
1 / 8
80 likes | 177 Views
SRB Image Archive with Cropping and Scaling for Environmental Niche Modeling. Cerulean Warbler. WhyWhere?. Cerulean Warbler. Answers the question "Where is it and why?" on a global scale. Frequency histogram of occurrence and background points.

E N D
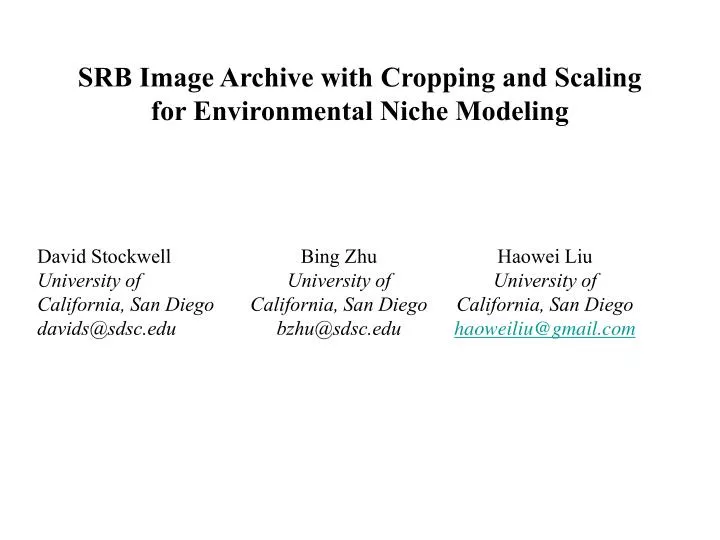
SRB Image Archive with Cropping and Scaling for Environmental Niche Modeling
Cerulean Warbler WhyWhere? Cerulean Warbler Answers the question "Where is it and why?" on a global scale.
Frequency histogram of occurrence and background points Occurrence and random background points overlain on variables Variable values Test accuracy on points Probability model Model applied to variables Variable values Basic prediction process
Data Sources: SEEK EcoGrid Datastorehttp://seek.ecoinformatics.org/ Currently Available •Terrestrial 398•Marine 558 • Global Ecosystems database (1deg - 1km) Topographic (DEM), Atmospheric, Climatic and Meteorologic, Hydrologic, Oceanographic, Ecosystems and Biogeochemical Dynamics, Geological and Geophysical Data - 10GB • Landsat 1km - %cover of treecover, evergreen, deciduous, broadleaf - 4GB • Marine - productivity, annual temperatures and deviations, salinity, at verious depths • Satellite - MODIS 12 level 3-4 land and 15 level 3-4 ocean products 1km to 250m tiled, 1TB to 4TB per annum • Digital Elevation - min, max, median elevation, slope, aspect, rugosity, hydrological variables - 30m - 1TB
Input point data (e.g. species locations) andco-registered environmental data layers • Iteration 1 test • 0.6 layer1 • 0.75 layer2 • ... • 0.91 layer(m) best • ... • 0.89 layer(n) • Iteration 2 test • .92 m.layer1 • 0.75 m.layer2 • ... • 0.95 m.layer(o) best • ... • 0.9 m.layer(n) • Iteration 3 test • .92 o.m.layer1 • 0.75 o.m.layer2 • ... • 0.96 o.m.layer(p) best • ... • 0.9 o.m.layer(n) • Cross-product • Cluster • Cross-product • Cluster Output model m.o, accuracy 0.95 WhyWhere? Parallel Prediction Algorithm
Conclusions – WhyWhere is… • More Accurate – more environmental data • Fast – X6 times GARP • Scalable – speedup to 20 processors • Explanatory – few variables • Cyberinfrastructure – online EcoGRID data store • Available – http://biodi.sdsc.edu